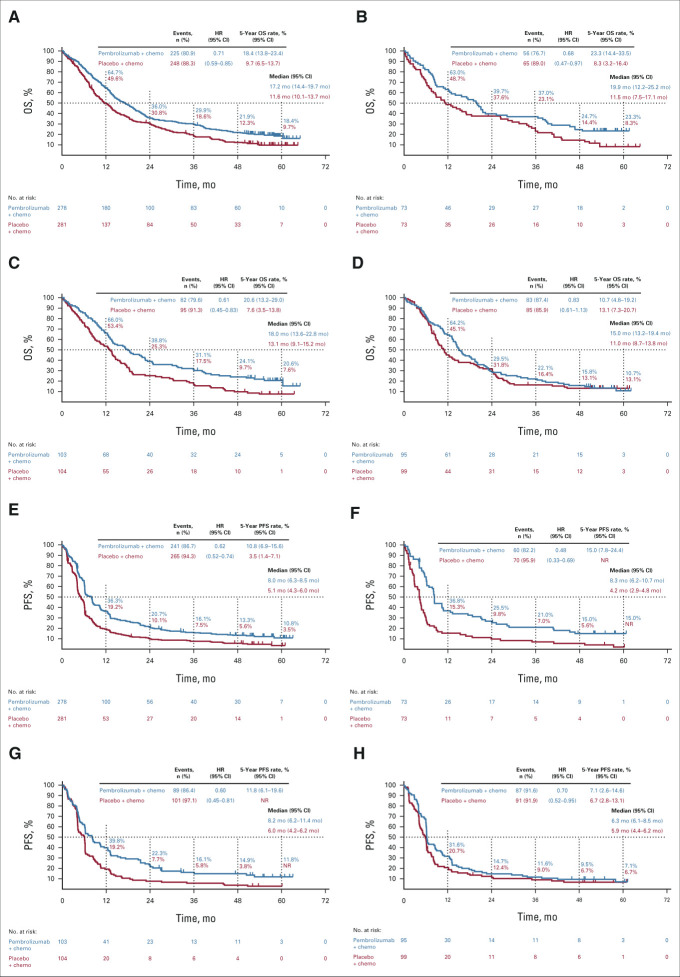
FIG 1.
Kaplan-Meier estimates of OS and PFS in the (A and E) ITT population, (B and F) patients with PD-L1 TPS ≥ 50%, (C and G) patients with PD-L1 TPS 1%-49%, and (D and H) patients with PD-L1 TPS < 1%. chemo, chemotherapy; HR, hazard ratio; ITT, intention to treat; NR, not reached; OS, overall survival; PD-L1, programmed death ligand 1; PFS, progression-free survival; TPS, tumor proportion score.

