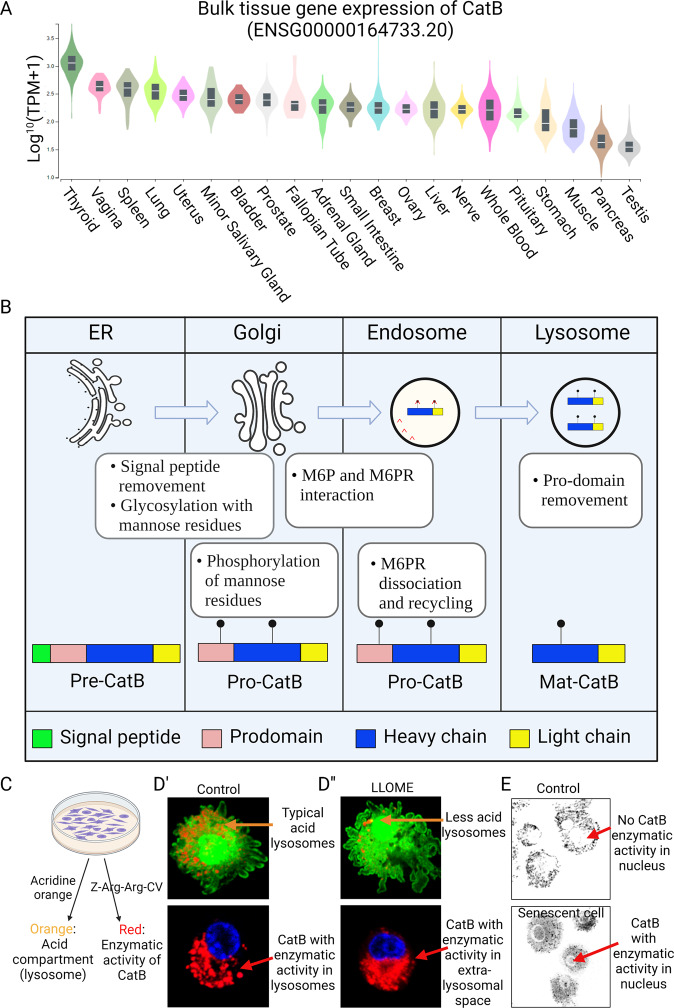
Fig. 1. CatB expression, maturation, and cellular distribution.
A CatB expression in various tissues. The data were obtained from the Genotype-Tissue Expression (GTEx) Project (https://gtexportal.org). Expression values are shown in TPM (transcripts per million), calculated from a gene model with isoforms collapsed to a single gene. B CatB maturation and lysosome-sorting pathway. C Methods to examine the lysosomal acid condition and CatB enzymatic activity. D’ Puncta signals (orange) of lysosomes with the acid environment and puncta signals (red) of CatB with enzymatic activity. D” LLOME increases the permeability of the lysosome membrane, resulting in a smaller number of acid lysosomes. LLOME-treated cells showed diffused CatB enzymatic activity. E Senescent cells showed CatB enzymatic activity in the nucleus but were not found in control cells.

