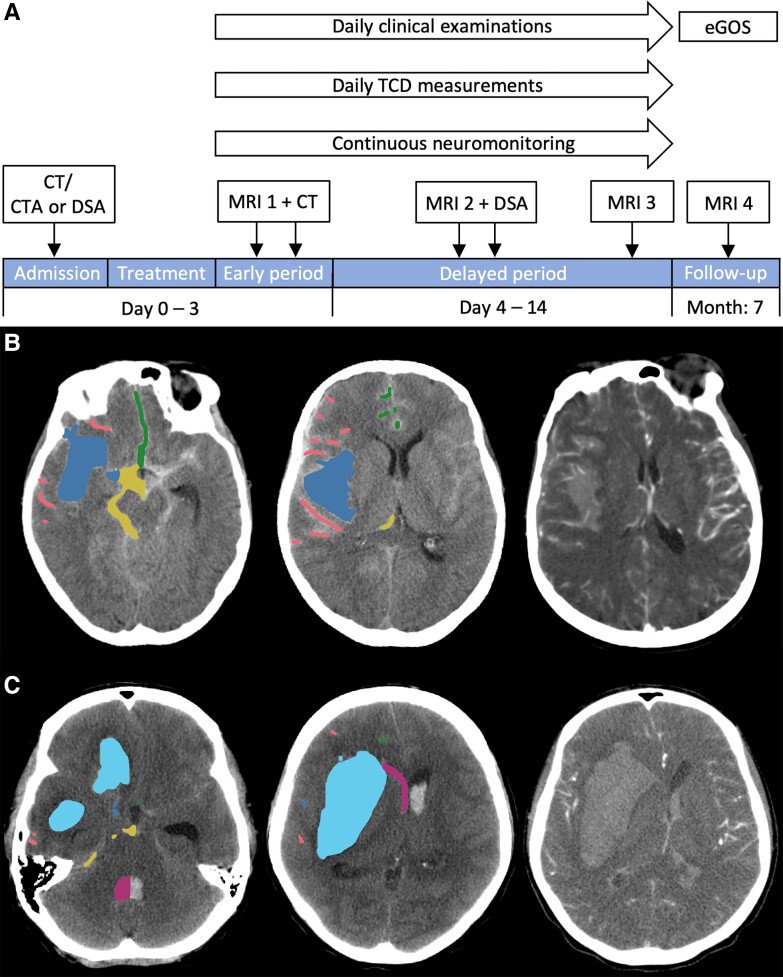
Figure 1.
Diagnostic flow of the DISCHARGE-1 study and quantification method for ipsilateral haemorrhage on the initial CT scan according to six predefined compartments. (A) CT and CTA were performed on admission. If necessary, CTA was complemented by DSA. The first MRI (MRI 1) was acquired 24–48 h after surgical or endovascular treatment of the aneurysm. In addition, a postoperative CT was performed to locate the subdural electrodes. In the delayed period, MRI 2 was performed around Day 7 and MRI 3 around Day 14. Note that delayed infarct volumes were quantified for both sessions separately and then added up for further analysis. A second DSA was performed around Day 7 to assess angiographic vasospasm. After treatment of the aneurysm, the patient was transferred to the neurocritical care unit, where continuous neuromonitoring, daily TCD and clinical examinations started and continued until Day 14. After 7 months, a follow-up MRI 4 was performed. Furthermore, functional outcome was documented using the extended Glasgow Outcome Scale (eGOS). (B) Representative CT and CTA images of a patient with aSAH from a right MCA aneurysm. Note that haemorrhage was only quantified in the hemisphere ipsilateral to the subdural electrodes. CTA (right image) demonstrated contrast-enhancing vessels inside a large right-sided haematoma. Therefore, the volume of this haematoma was quantified according to the category of subarachnoid blood in the Sylvian fissure (bloodSylvian) (blue label in left and middle image). Bloodconvex comprised blood in the sulci at the cerebral convexity including the rami of the Sylvian fissure (red label). Bloodinter was composed of blood in the anterior and posterior interhemispheric fissure as well as adjacent sulci (green label). Interhemispheric blood that crossed the midline was classified as contralateral and was not considered. Bloodbasal included blood in the following cisterns: prepontine, interpeduncular, suprasellar, ipsilateral ambient, quadrigeminal and the interpositum cistern (yellow label). Subdural blood, seen as narrow hyperdense fringe overlying the left frontal cortex, was not quantified. (C) Representative CT and CTA images of another patient with aSAH from a right MCA aneurysm. CTA (right image) demonstrated contrast-enhancing vessels of the M2 segment of the MCA outside a large right-sided haematoma. Therefore, this haematoma volume was quantified within the ICH category (cyan label in left and middle image). Blood in the ventricular system is shown in purple. Most notably, a large clot was found in the fourth ventricle. This was only quantified until the midline (purple label). Bloodbasal (yellow label), bloodinter (green label) and bloodconvex (red label) were small in this patient.

