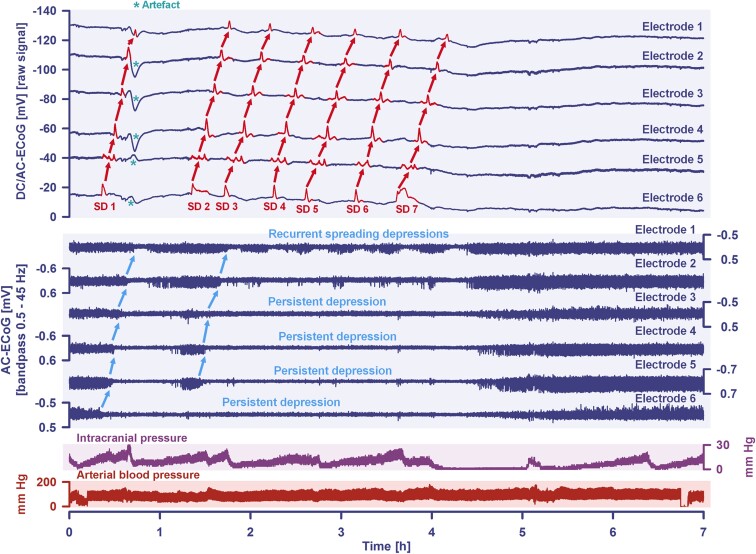
Figure 3.
A cluster of seven SDs is shown that occurred in the same patient as in Fig. 2 during a period of 4 h on Day 7 after the initial haemorrhage. Traces 1–6 from top to bottom give the DC/AC-ECoG recordings (band-pass: 0–45 Hz). SDs are observed as a negative DC shift (marked in red in the traces). The SDs propagated across the cortex from electrode 6 to electrode 1. The direction of the propagation (shown by the red arrows) suggests that the SDs originated in an area closer to electrode 6 than to electrode 1. An artefact that likely relates to a systemic change in partial pressure of oxygen is marked with an asterisk after the first SD in traces 2–6. The following six traces (7–12) show the depressive effect of the SDs on the spontaneous brain activity as assessed in the high frequency band (AC-ECoG, band-pass: 0.5–45 Hz). Note that the activity depression propagates together with the SDs in the tissue (blue arrows). The spontaneous activity recovers after each SD only in electrode 1 (trace 7) and partially in electrode 2 (trace 8). In contrast, a persistent depression of activity is observed after the second SD in electrodes 3–5 (traces 9–11) and after the first SD in electrode 6 (trace 12). Thus, SDs 2–7 propagate in electrically silent tissue and are classified accordingly as isoelectric SDs.72 Of note, the longest SD-induced activity depression is found in trace 12 closer to the origin of SDs. Trace 13 shows the intracranial pressure measured via extraventricular drainage catheter. Trace 14 shows the systemic arterial pressure (measured via radial artery catheter).

