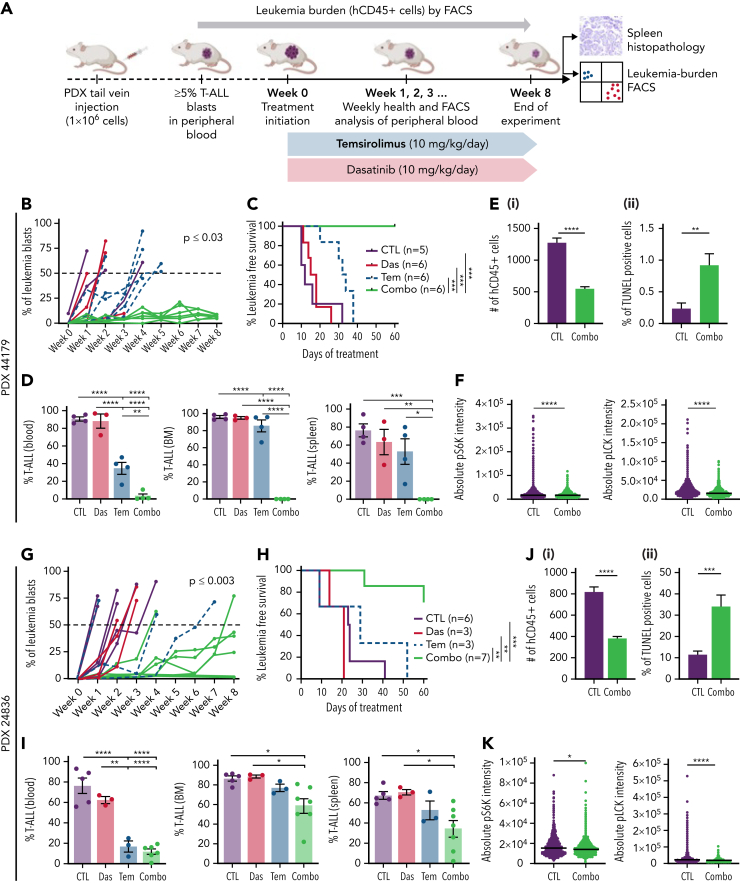
Figure 7.
Combination of dasatinib and temsirolimus suppresses T-ALL growth in patient-derived xenografts. (A) Schematic of experimental design. (B-F) PDX 441979. (G-K) PDX 24836. (B,G) Leukemia burden assessed by the percentage of CD45+ T-ALL in the peripheral blood of engrafted mice. Combination therapy curbed tumor growth compared with control treated mice. P values denote differences based on 1-way analysis of variance followed by Tukey post hoc test. (C,H) Kaplan-Meier survival curves. (∗P < .05; ∗∗P < .01; ∗∗∗P < .001, log-rank, Mantel-Cox test). (D,I) Flow cytometry quantification of hCD45+ T-ALL cells detected in the spleen, bone marrow (BM), and peripheral blood of engrafted mice at the end of treatment. Error bars equal ± SEM. (E,J) Quantification of spleen sections showing total number of hCD45 T-ALL cells/3 mm2 (i) and TUNEL (ii). Error bars denote ± standard deviation. (F,K) Quantification of phospho-LCK or phospho-S6K staining in CD45+ T-ALL cells found in the spleen based on IHC staining. Average intensity is denoted by black bars quantified across >3 animals per condition and 3 sections per spleen. More than 3000 cells were analyzed per condition. ∗P < .05; ∗∗P < .01; ∗∗∗P < .001; ∗∗∗∗P < .0001; Student 2-tailed t test (D-F,I-K).

