Figure 3.
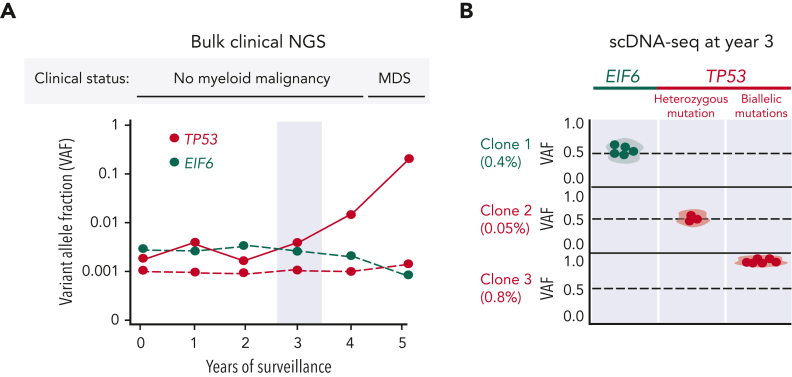
Clonal dynamics of somatic mutations in SDS. (A) Representative example of clinical NGS in a patient with SDS undergoing serial bone marrow examinations. TP53- and EIF6-mutated clones are colored red and green, respectively. Solid red line corresponds to the biallelic TP53 clone that eventually progresses to MDS. Light-blue bar highlights year 3 of bone marrow surveillance. (B) scDNA-seq at year 3 of surveillance. Each row represents a unique EIF6- and TP53-mutated clones with VAF as a percentage below. Each dot corresponds to a single cell belonging to a given clone. Heterozygous mutations have a VAF of ∼0.5. The TP53 mutation in clone 3 has a VAF of ∼1.0, indicating biallelic TP53 mutation. The biallelic TP53-mutated clone expands exponentially and represents the dominant clone at the time of MDS diagnosis. This scenario demonstrates the ability of scDNA-seq to reveal the clonal hierarchy of somatic mutations and identify high-risk TP53 mutations years before the clinical diagnosis of a myeloid malignancy. In addition, we provide a specific clinical example in the text describing a patient with SDS who was found to have a detectable biallelic TP53-mutated clone using scDNA-seq that eventually gave rise to leukemia despite no other concerning clinicopathologic or cytogenetic features during routine surveillance of bone marrow and blood counts a few months preceeding leukemia diagnosis.

