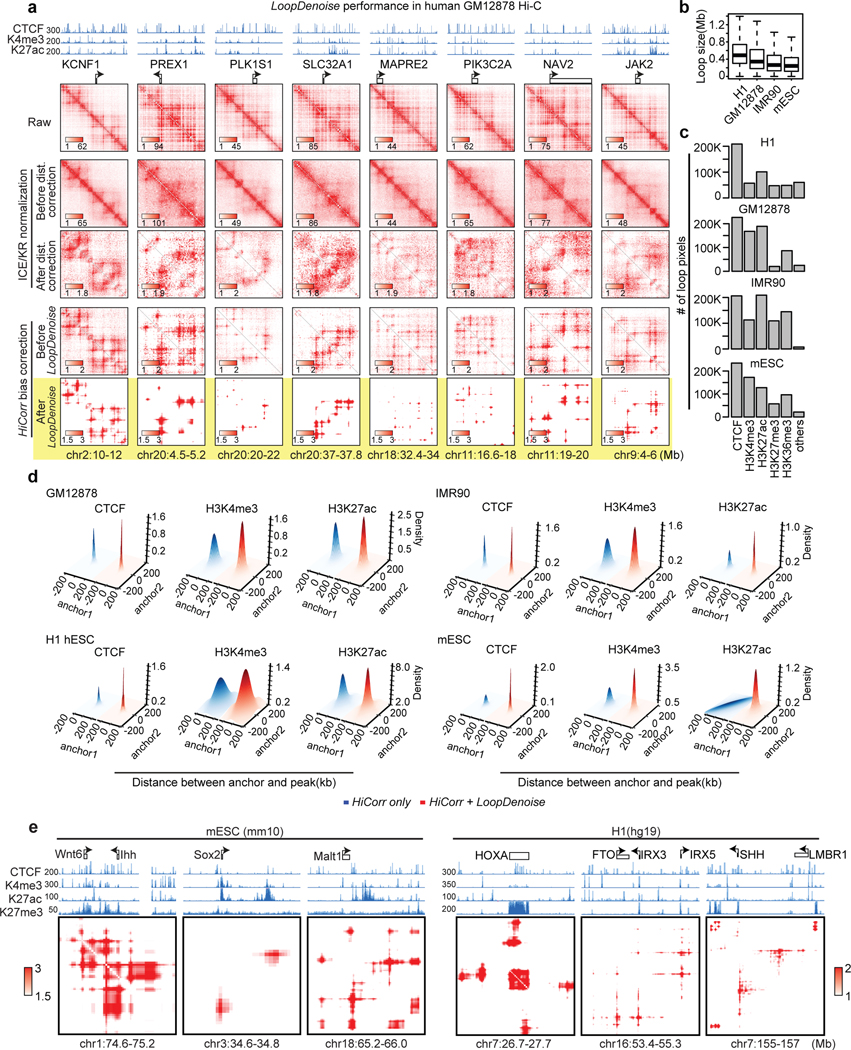
Extended Data Fig. 2. LoopDenoise generalization across cell types and species.
a, Eight heatmap examples in GM12878, the highlight row is the output from LoopDenoise. b, The distance distribution of top 300K pixels in H1(hESC), GM12878, IMR90 and mESC. Upper and lower limits of boxes indicate interquartile ranges, center lines indicate median values, whiskers indicate values with a maximum of 1.5 times the interquartile range and outliers indicate values beyond 1.5 times the interquartile range. c, The number of loops pixels with at least one anchor overlapped with ChIP-seq peaks out of top 300K pixels. d, Density plots show the distribution of distances between loop anchors (top 100K loop pixels used) and their nearest ChIP-seq peaks in GM12878, IMR90, H1(hESC) and mESC. e, The heatmap examples of six loci with known long-range gene regulation. The height of browser tracks indicating the raw counts of ChIP-seq.

