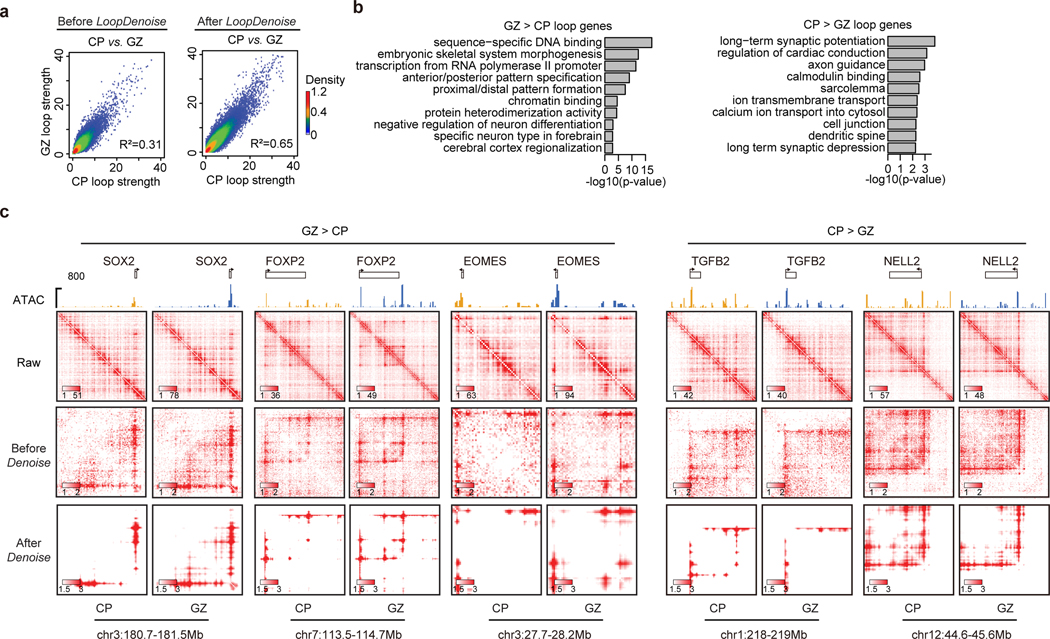
Extended Data Fig. 3. LoopDenoise enables the quantitation of dynamic chromatin interactions.
a, Scatterplots showing the pixel-level correlation between CP and GZ sample in human fetal cortex before and after LoopDenoise. The R-square values were also shown in the plots. b, GO analyses of genes associated with GZ- or CP-specific loops. Fisher’s Exact test was used to measure the gene-enrichment in annotation terms. c, The contact heatmaps of selected gene loci with top GZ- or CP-specific loop pixels. ATAC-seq tracks in CP (yellow) and GZ (blue) are also included for comparison. The height of browser tracks indicating the raw counts of ATAC-seq.

