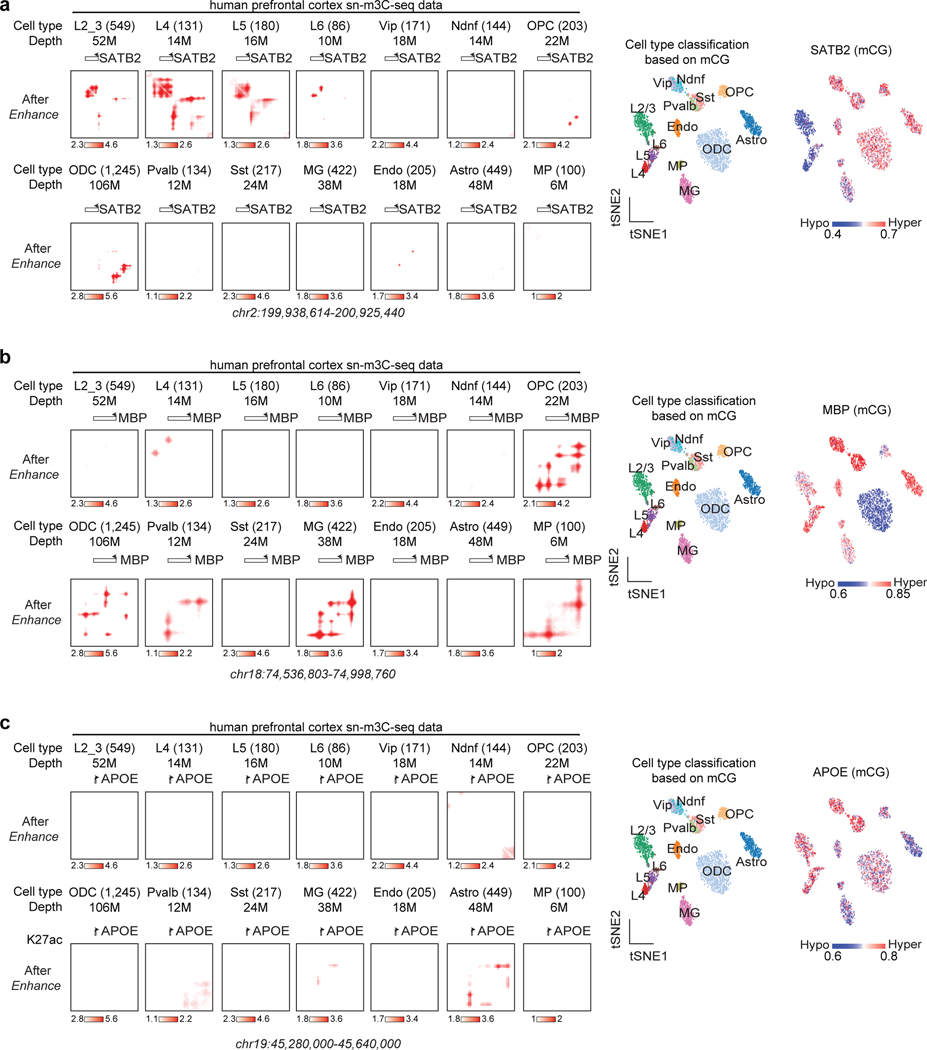
Extended Data Fig. 7. DeepLoop reveals cell type specific loop interactions from sn-m3C-seq data.
Same as Fig. 4e,f, single cells from the same cell type are pooled and enhanced by DeepLoop. The tSNE plots show the identities of each cell population (left) and the methylation level at the locus of interest (right).

