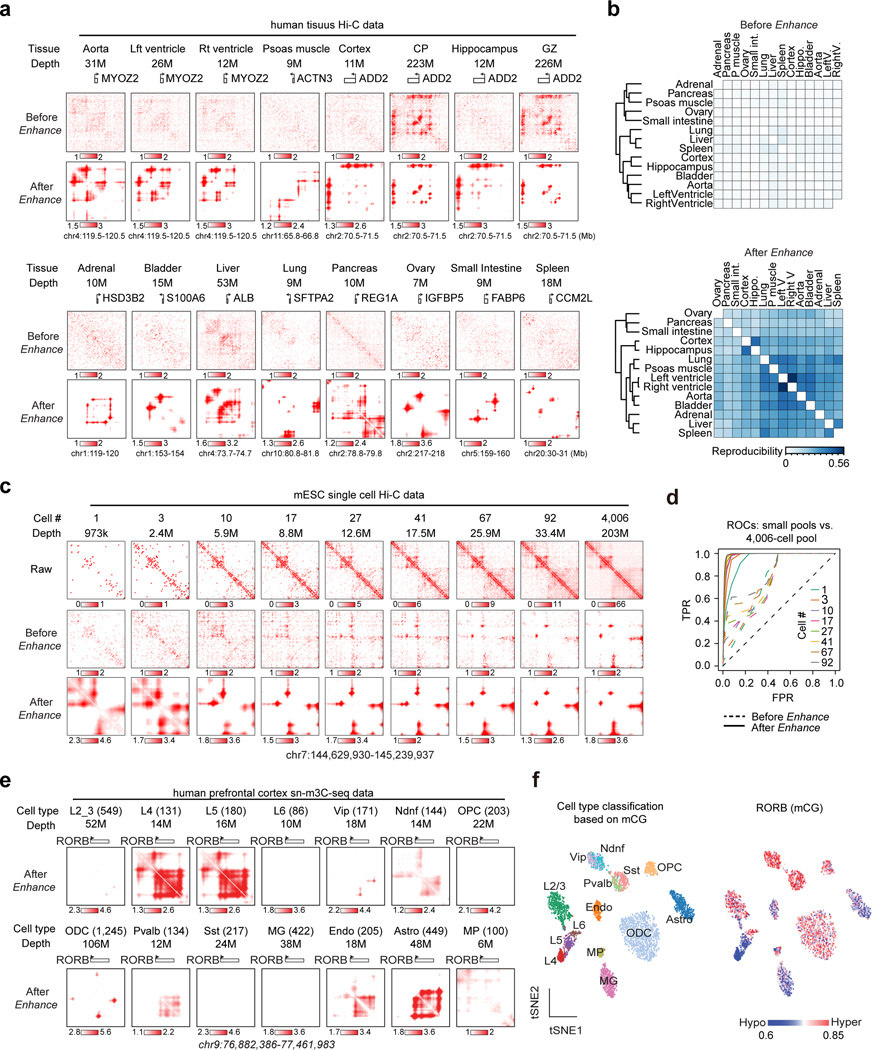
Figure 4. DeepLoop identifies chromatin interactions from low-depth and single cell Hi-C data.
a, Contact heatmaps of exemplary marker genes in 14 published low-depth human tissue Hi-C data. High-depth CP and GZ are also included for comparison to brain tissue maps. The numbers of mid-range cis contacts are indicated for each tissue. b, the reproducibility refers to the fraction of overlapped loop pixels between the top 100K loop pixels from every two tissues, which are used for tissue clustering before and after signal enhancement. c, Analysis of single cell Hi-C data. After pooling different number of single mESC cells (read depth indicated for each pool), the raw, HiCorr-corrected, and enhanced heatmaps are shown. Heatmaps for the pool of 4,006 diploid cells are shown in the last column. d, ROC curves for each enhanced Hi-C map using the top 300K loop pixels from the 4,006-cell dataset (LoopDenoise output) as true positives. e, Single cells from the human PFC sn-m3C-seq data are split into 14 populations based on cell types. Data from the same population are pooled and processed with DeepLoop. The heatmaps are at the RORB locus; number in parentheses indicate the number of cells for each population. f, left: tSNE plot showing the cell type identification by methylation profile; right: the methylation levels of RORB for every cell are visualized on the same tSNE plot.

