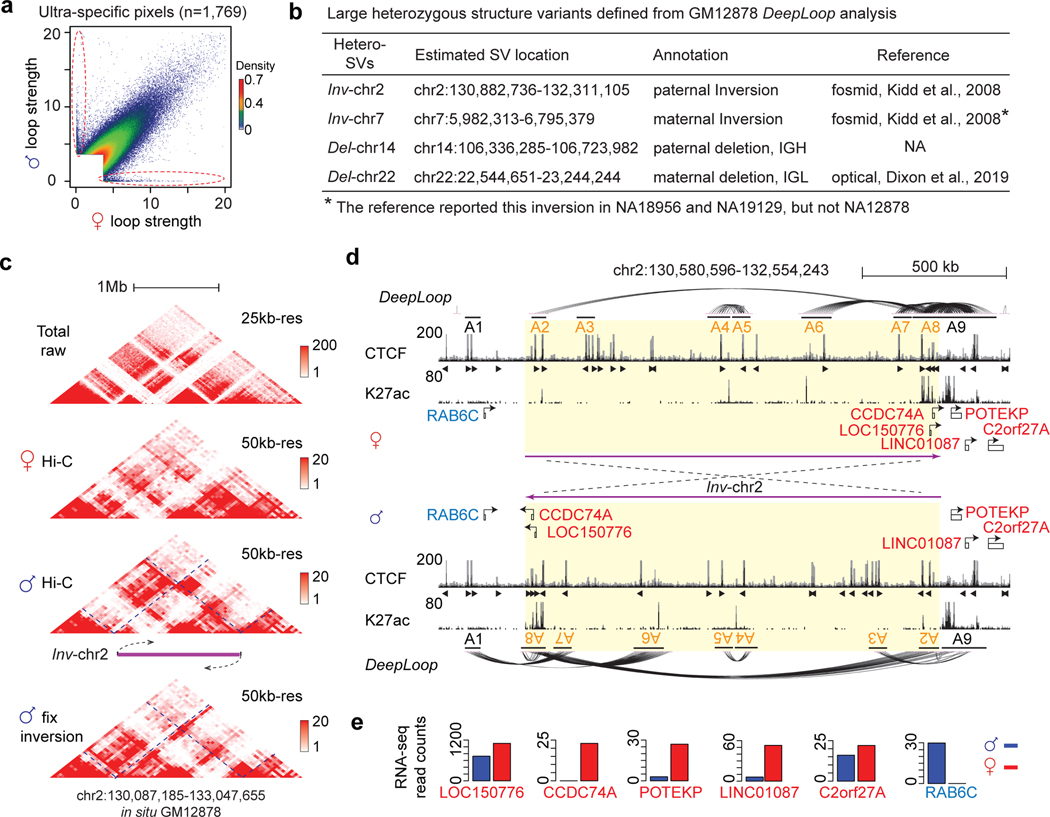
Figure 7. Allelic DeepLoop maps can detect and functionally characterize large heterozygous SVs.
a, Scatterplot showing the ultra-specific loops (in red circles). b, Four large heterozygous SVs containing a majority of the ultra-specific loops. c, The raw contact heatmaps of the Inv-chr2 locus. The “corrected” raw heatmap of the inverted paternal allele is included (“fix inversion”). d, The genome browser track of the Inv-chr2 locus shows CTCF and H3K27ac binding and chromatin loops in the un-inverted maternal allele and the inverted paternal allele. e, Bar plots showing the allelic expression of the genes highlighted in d at the inversion boundaries.

