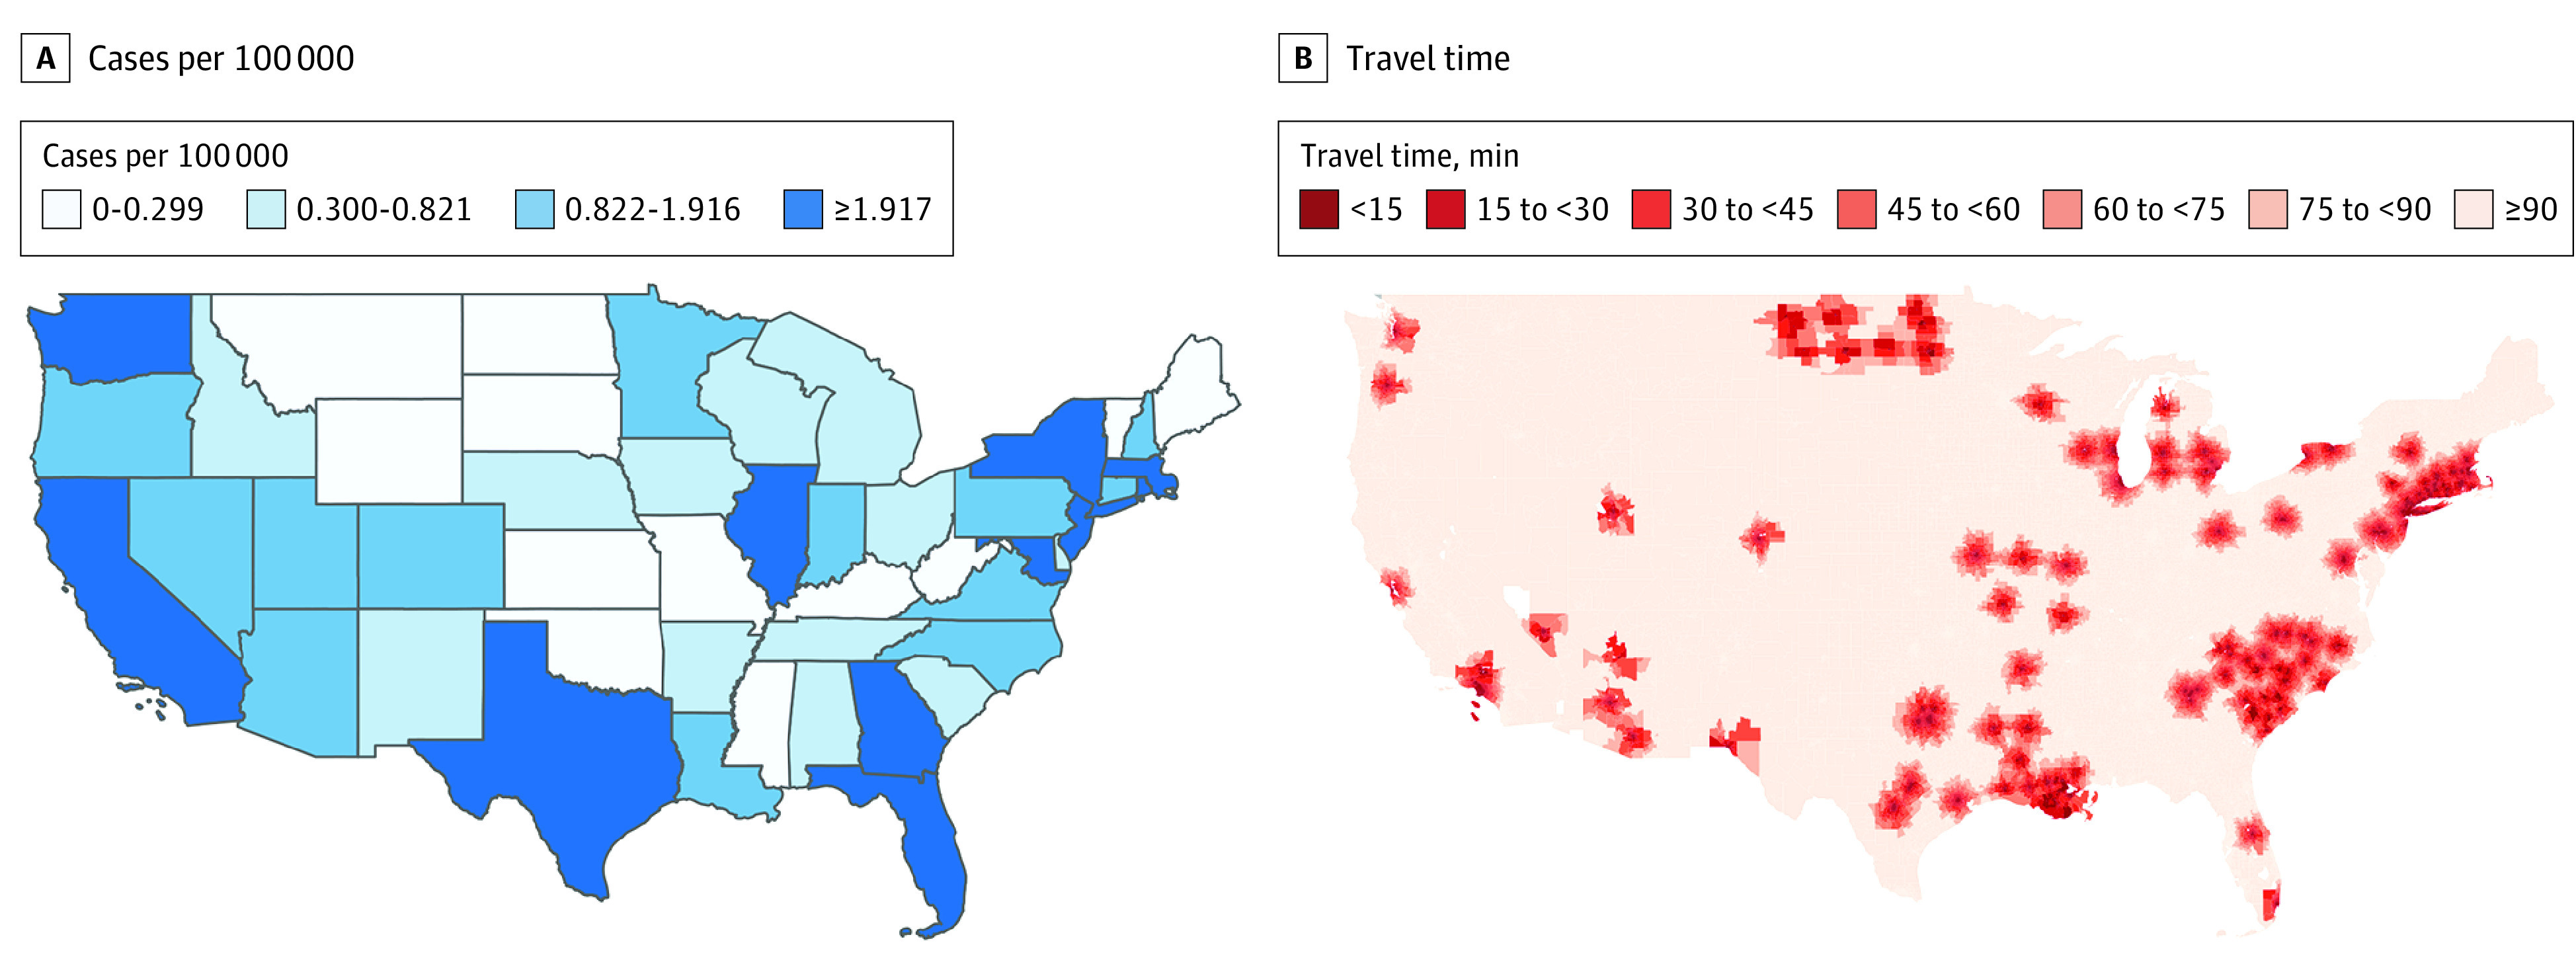
Figure. State Prevalence Rate and Minimum Travel Time to Mpox Vaccination Site as of August 2022.

Maps show US cases of mpox by state per 100 000 (A) and travel time to a destination site (B).

Maps show US cases of mpox by state per 100 000 (A) and travel time to a destination site (B).