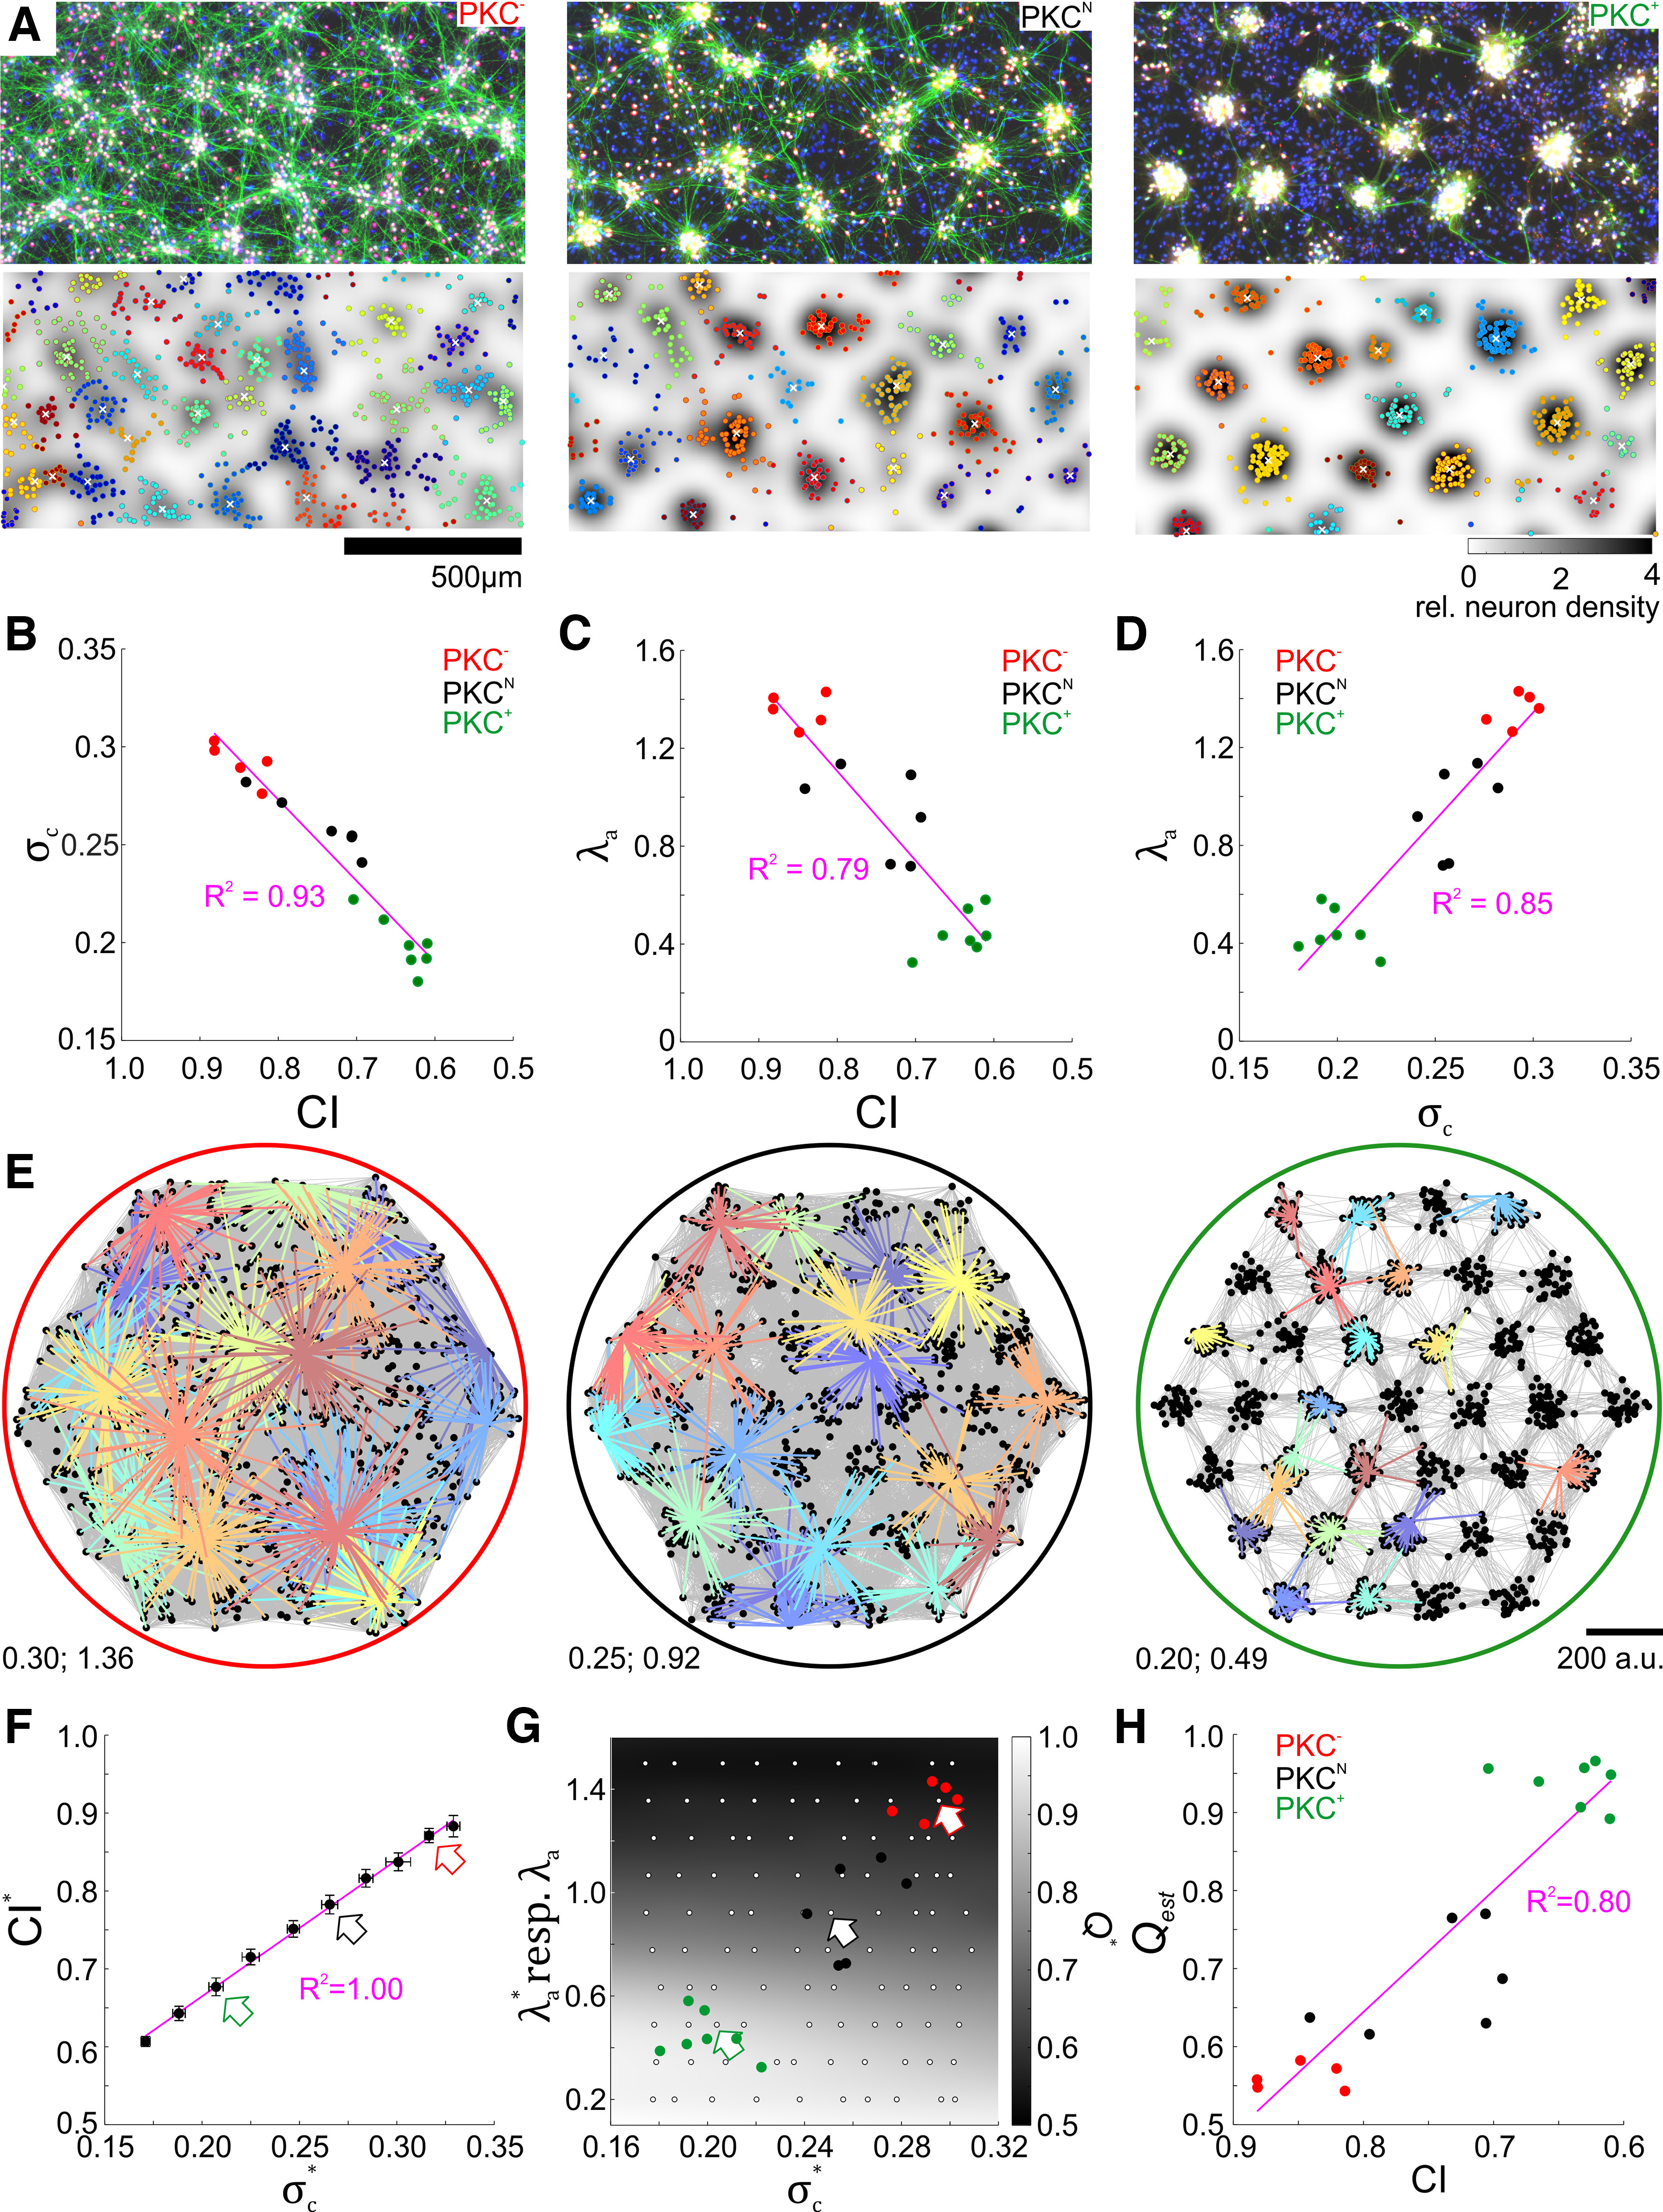
Figure 1.

Clustering and structural modularity in developing networks. A, Chronic pharmacological modulation of PKC activity altered the mesoscale architecture of self-organizing networks in vitro. Top, Fluorescence micrographs showing somata (red, NeuN), axons (green, NF) and cellular nuclei (blue, DAPI) in networks with modified PKC activity at 20 DIV (somata appear white because of colocalization of NeuN with NF and nuclear stain). Bottom, Cluster identification (marker color) and assignment of neurons to clusters based on peaks (white crosses) in the landscape of relative neuron density (background). Clusters become more compact and delimited from left to right. B, Cluster spread relative to ICD () decreased with increasing clustering (decreasing CI). C, Average length of axon per neuron relative to ICD () decreased with increasing clustering. D, Relative cluster spread and relative axon length were positively correlated. E, Networks resembling those observed in vitro were modeled by increasing relative cluster spread () and axonal projection range () relative to the ICD, respectively (bottom left, labels denote ; ), within experimentally approximated ranges. Perimeter color refers to networks representing PKC+, PKCN, and PKC− conditions. Colored lines are projection patterns of individual neurons. F, As in vitro, CI* in simulated networks increased toward 1 (random distribution) with increasing (arrow colors refer to networks in E; error bars indicate SD across networks). G, Structural modularity Q* mainly depended on and was weakly influenced by only in combination with a short projection range. Gray values were interpolated from combinations of and in simulated networks (white markers; colored arrows refer to networks in E). and of in vitro networks were within the parameter range simulated (colored markers, data from D). H, Structural modularity of in vitro networks estimated from the map in G (Qest) was strongly correlated with CI. In B-D, F and H, magenta line and label show the linear regression with respective coefficient of determination (R2) .
