Figure 5.

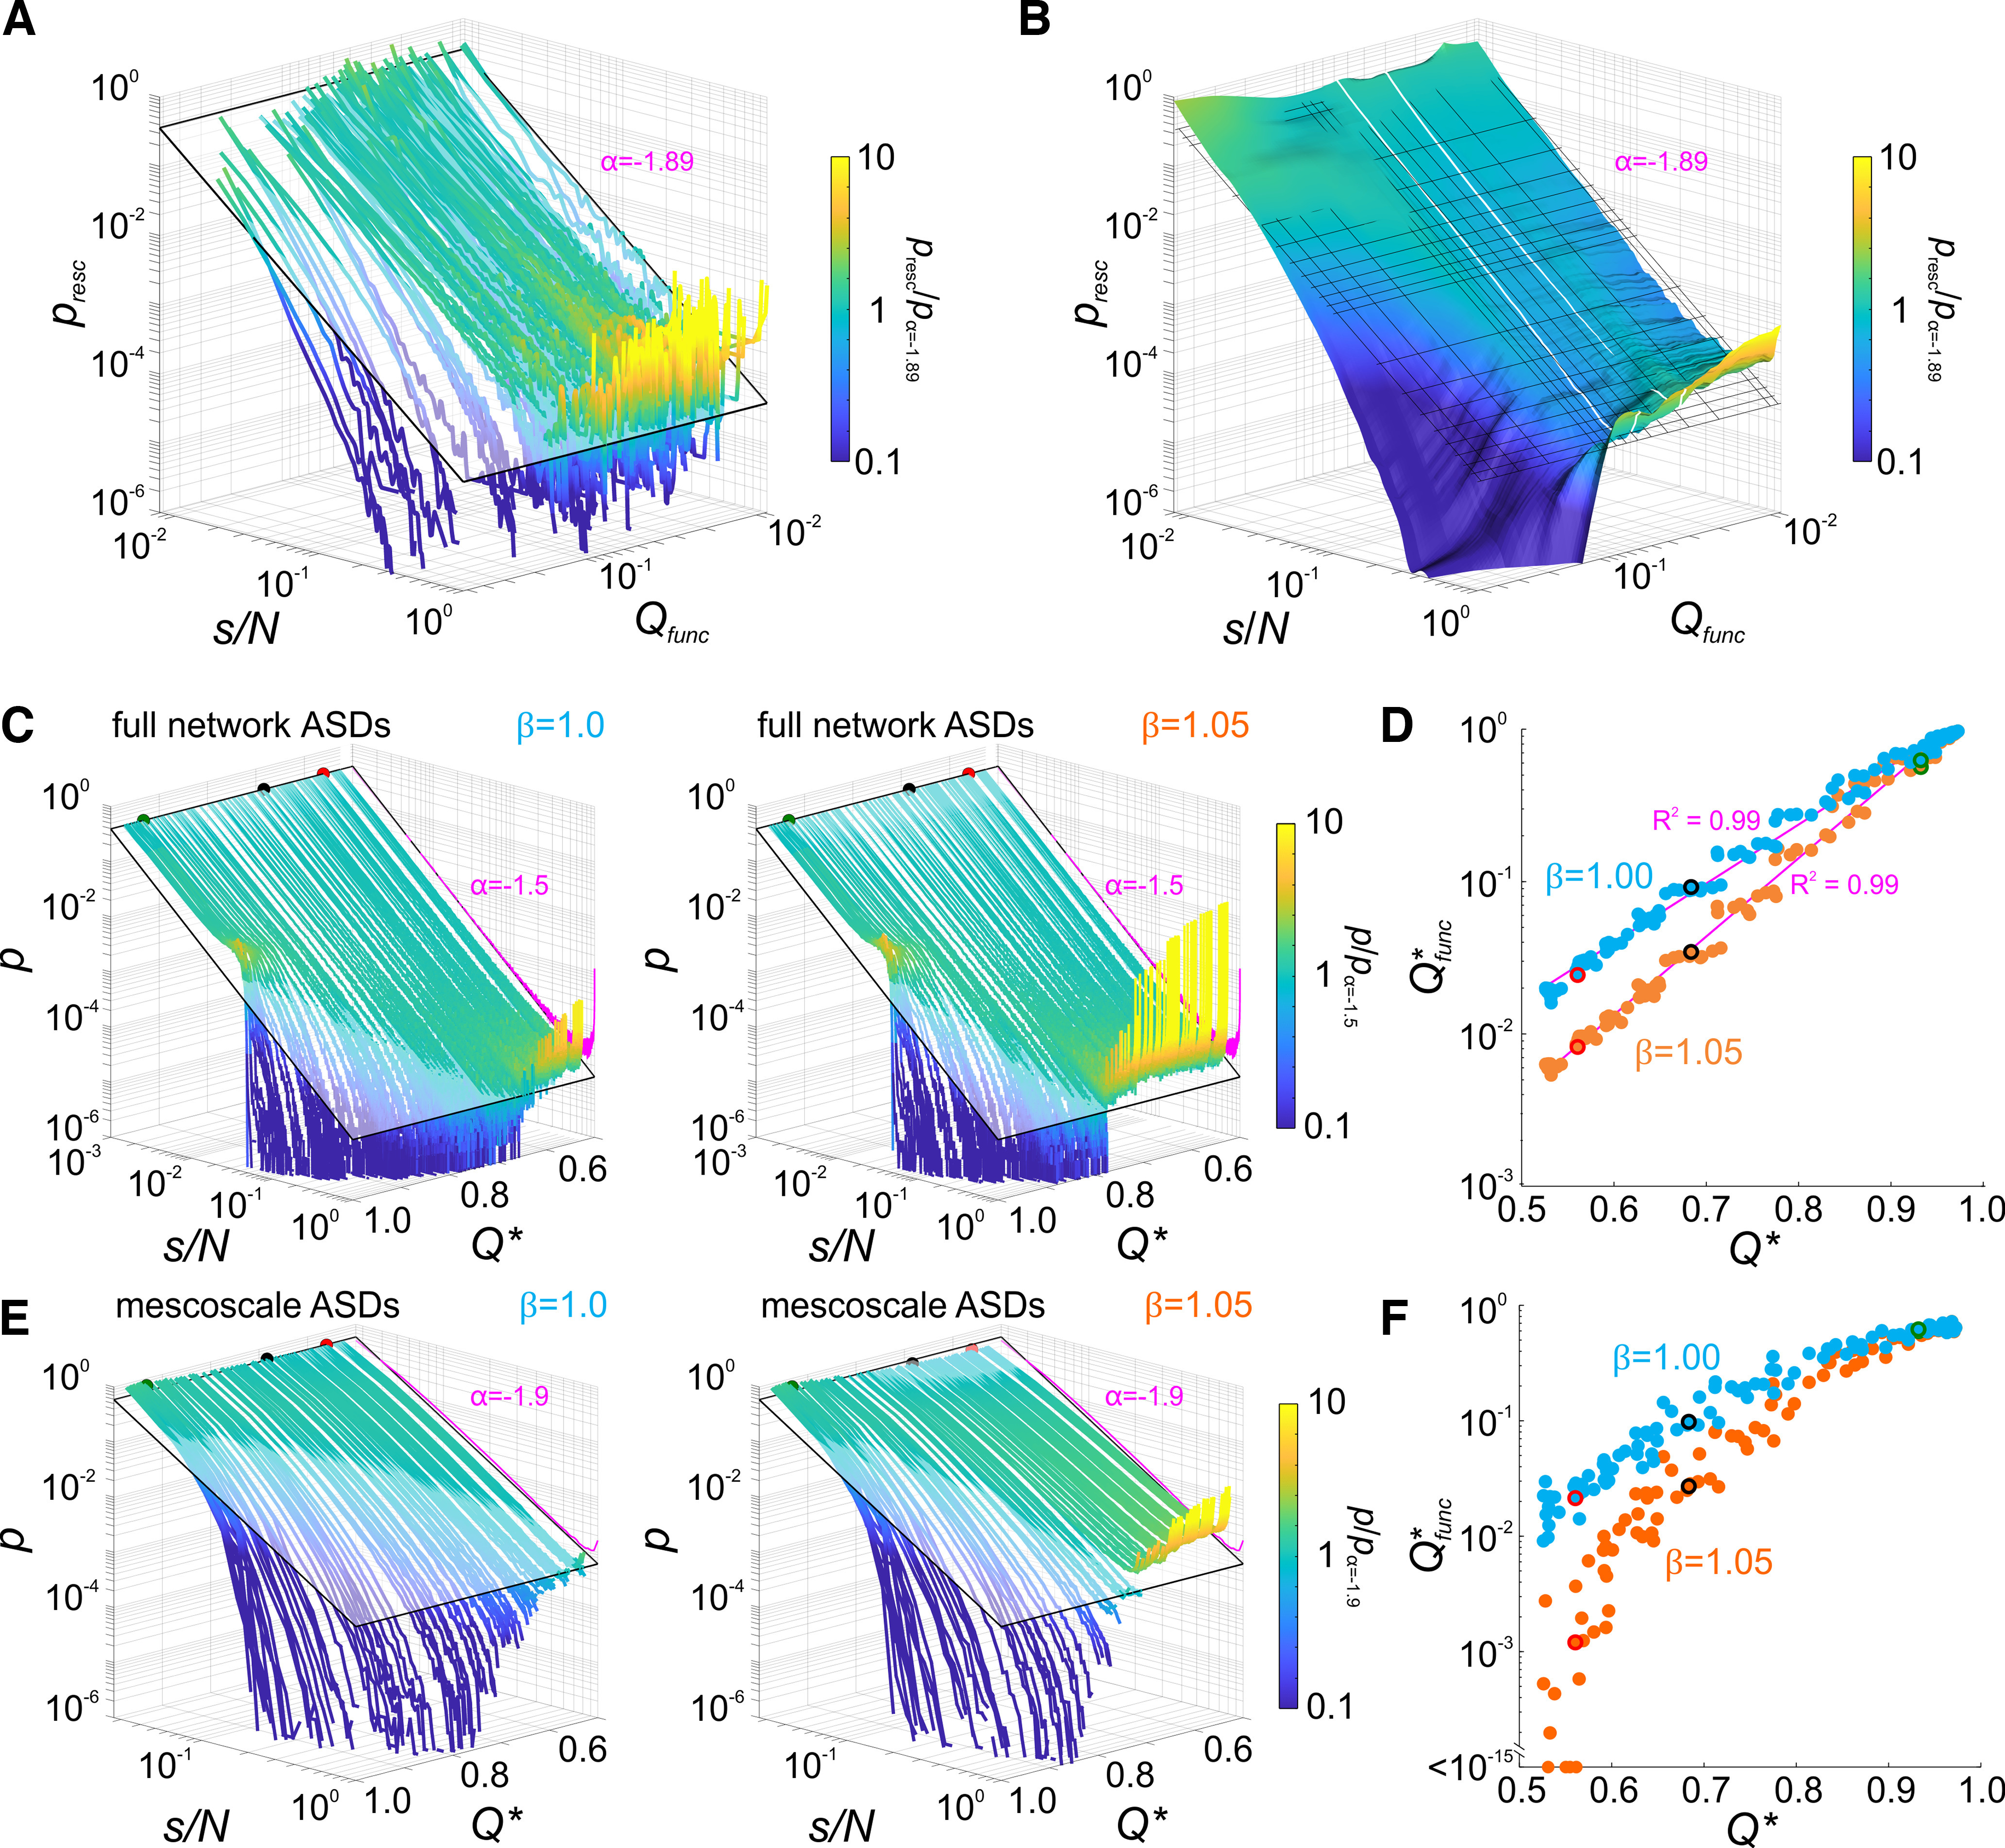
Clustering and modularity determine mesoscale avalanche statistics. A, B, ASDs sorted as a function of Qfunc. ASDs gradually transition from concave (subcritical) to convex (supercritical) shapes with decreasing Qfunc. Close to power law ASDs occur at moderate Qfunc. Line or surface color in A and B indicate the pointwise ratio of avalanche size probability and a power law with = −1.89 shown as a tilted plane or grid. B, Surface obtained by moving median smoothing of the array of ASDs in A to visualize the gradual transition. White lines delimit the moderate Qfunc group in Figure 4B. C, Full network ASDs derived from simulations of probabilistic activity propagations (N = 1000 neurons; networks in Fig. 1E–G). Left, ASDs become increasingly subcritical with increasing structural modularity Q*, although neurons on average activate one postsynaptic neuron (branching ratio = 1). ASD line color denotes pointwise ratio with a power law, indicated by a plane with = −1.5. The ASD with finite-size effects expected for random connectivity is shown at Q* = 0.6 for reference. Right, Increasing to 1.05 resulted in supercritical ASDs in networks with low Q*. Increasing Q* dampened supercritical recruitment toward critical and subcritical ASDs (color code and reference lines as in left). D, Q*func derived from the recruitment statistics in simulated networks (as in Fig. 3) scaled exponentially with Q* and depended on . Increasing from 1.0 to 1.05 reduced the functional modularity Q*func for a given structural modularity Q*, with increasing reduction toward lower Q* (steeper slope; magenta lines, regression with logarithmic Q*func-axis). E, Avalanche dynamics subsampled at the mesoscale level (using only activity of the two neurons closest to each of the respective cluster centers; N = 37) mimics MEA recordings (same simulations as in C). s/N hence denotes the fraction of sampled sites (1 per cluster) recruited in an avalanche. Mesoscale ASDs show the same dependence on Q* as full network ASDs, however, with a steeper slope α = −1.9 and reduced finite size effect (shown in A and B). ASD line color denotes pointwise ratio with a power law ( = −1.9). ASD effects expected for random connectivity shown at Q* = 0.6 for reference. F, The reduction of Q*func with decreasing Q* was more pronounced with subsampling. For = 1.05 and low Q*, Q*func decayed toward zero indicating full recruitment of the sampled sites during avalanches.
