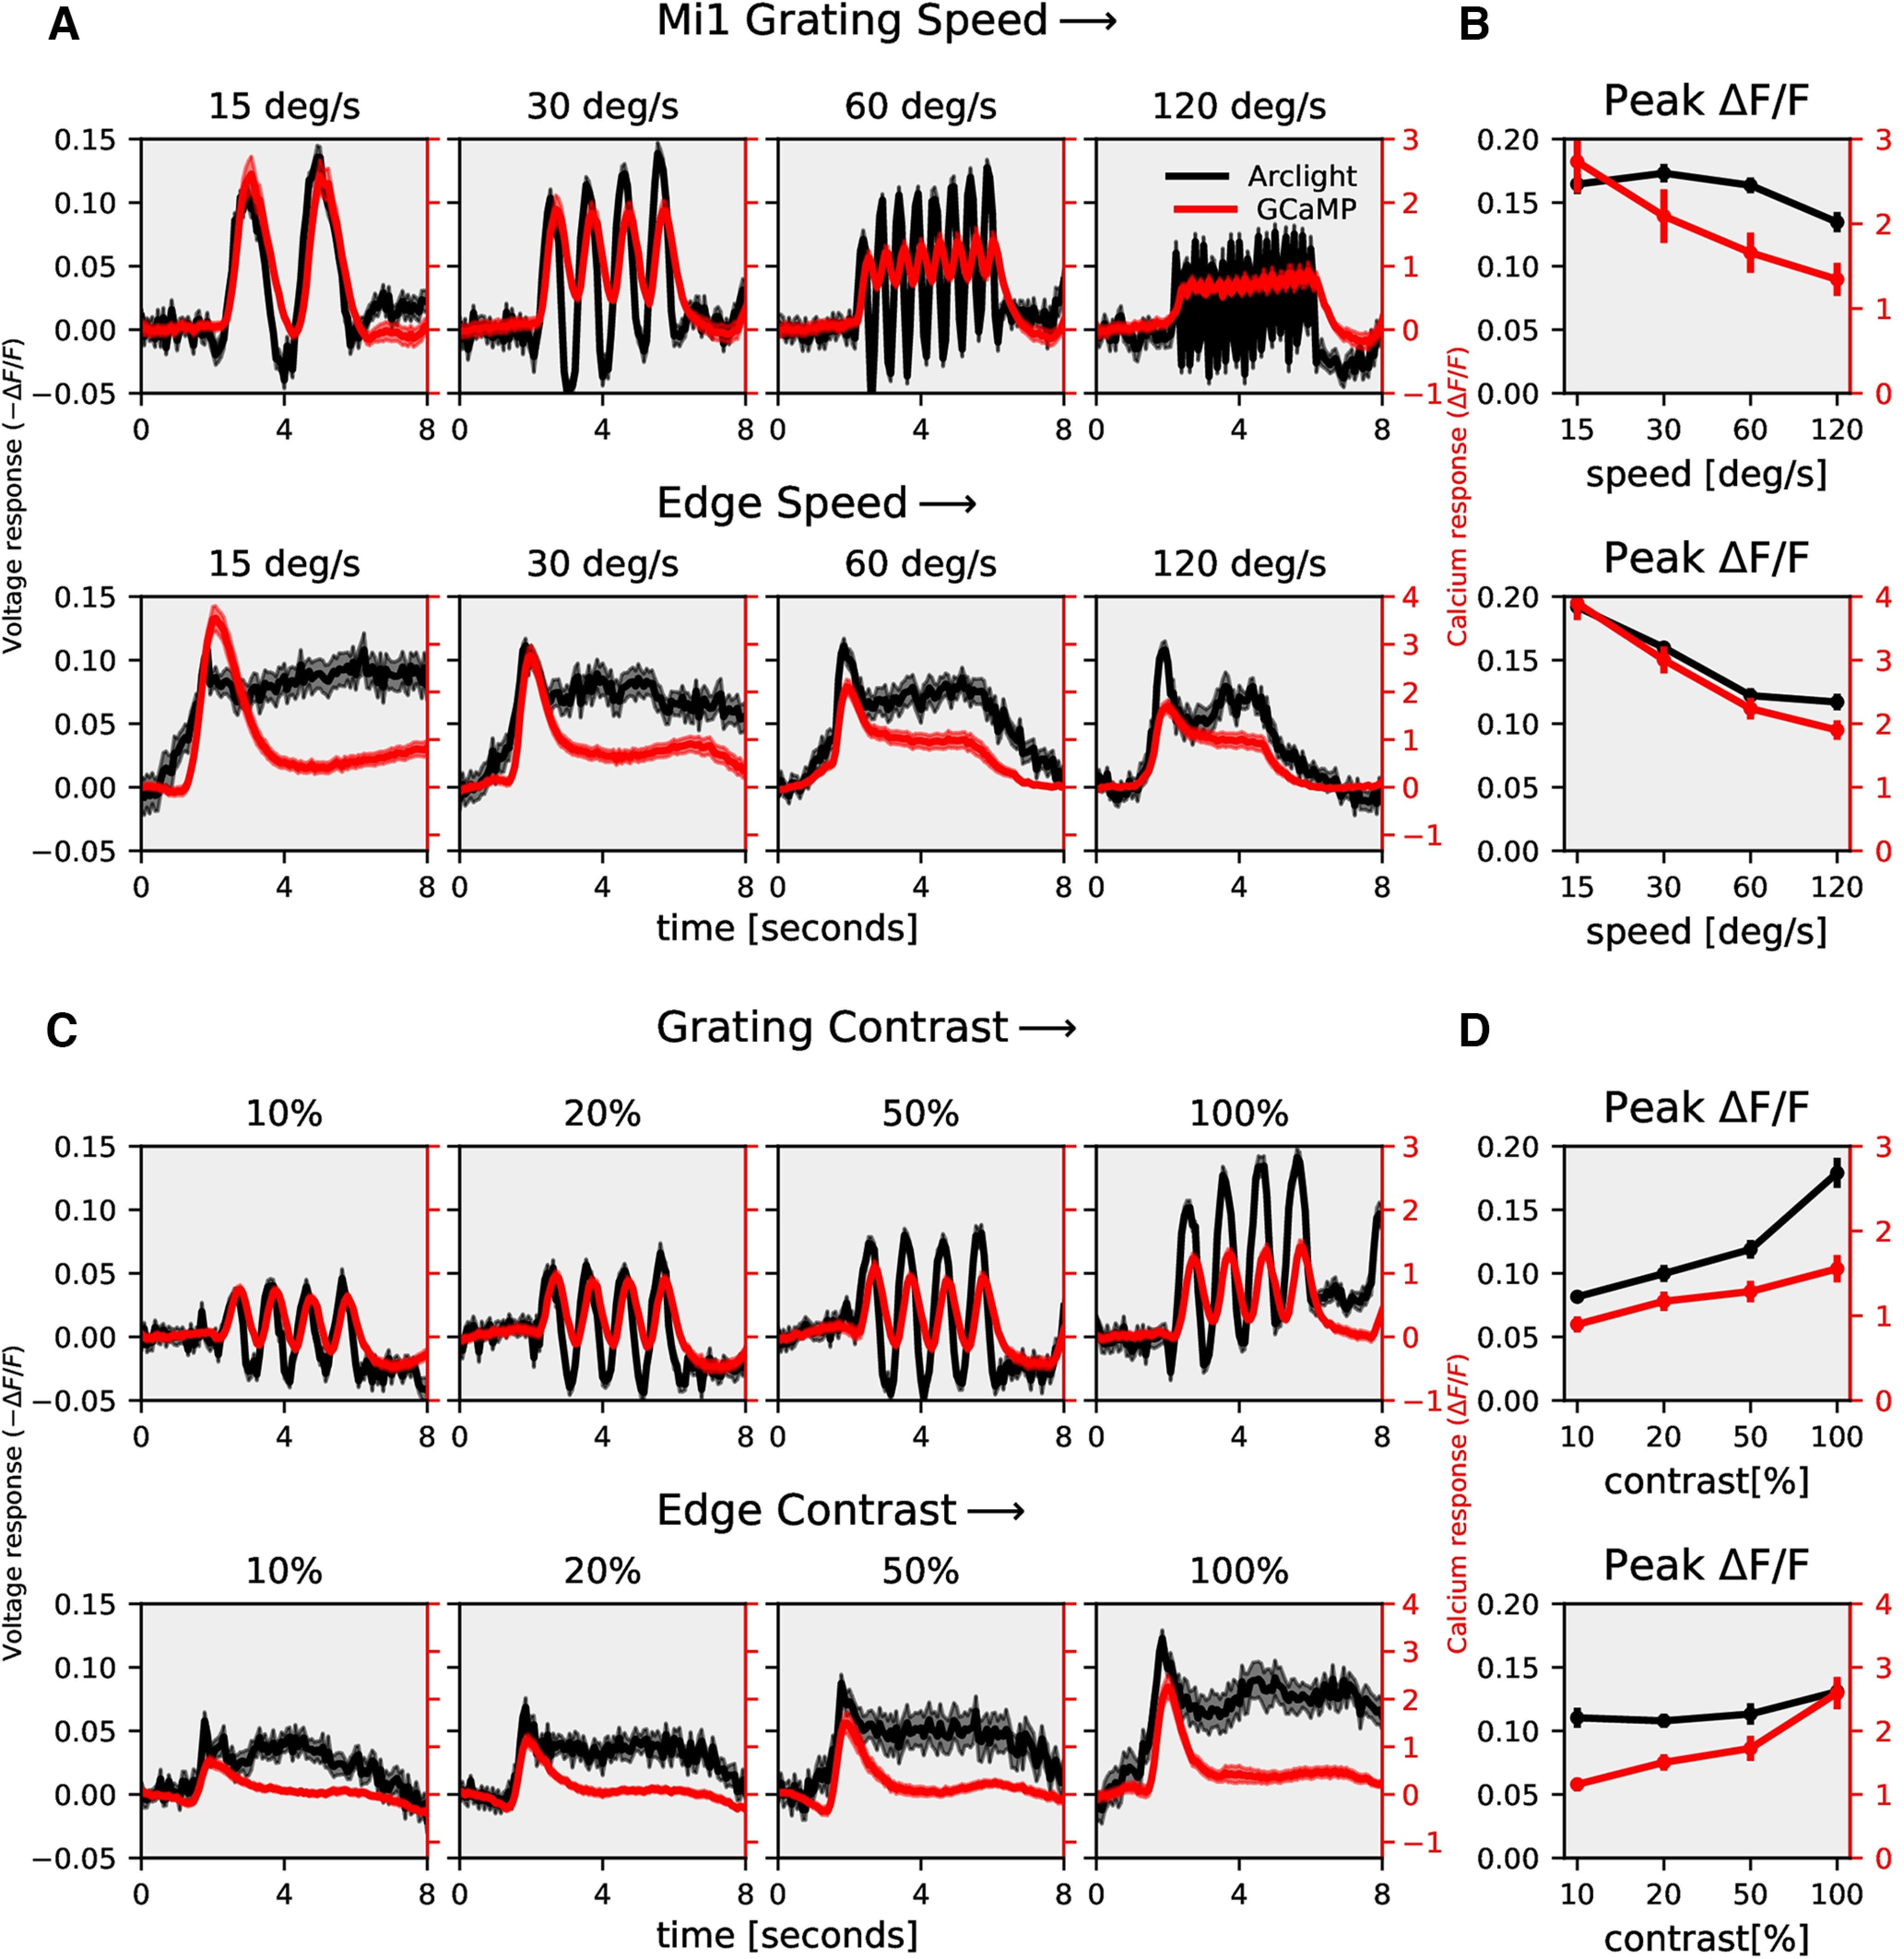
Figure 7.

Mi1 speed and contrast dependence. A, Mi1 ArcLight (black) and GCaMP6f (red) responses to grating (top row) and edges (bottom row) moving at four different speeds (gratings: n = 24 ROIs from N = 5 flies for ArcLight, n = 19, N = 5 for GCaMP; edge: n = 27, N = 4 for ArcLight, n = 35, N = 5 for GCaMP). B, Mi1 peak responses to gratings (top) and edges (bottom) moving at four different speeds (top). C, Mi1 ArcLight (black) and GCaMP6f (red) responses to grating (top row) and edges (bottom row) moving at four different contrasts (gratings: n = 24 ROIs from N = 5 flies for ArcLight, n = 22, N = 5 for GCaMP; edge: n = 18, N = 4 for ArcLight, n = 24, N = 5 for GCaMP). The left y-axis of the plot represents voltage responses, i.e., changes in ArcLight fluorescence (−ΔF/F) and the right y-axis of the plot represents calcium responses, i.e., changes in GCaMP6f fluorescence (ΔF/F). D, Mi1 peak responses to gratings (top) and edges (bottom) moving at four different contrasts. All data show the mean ± SEM.
