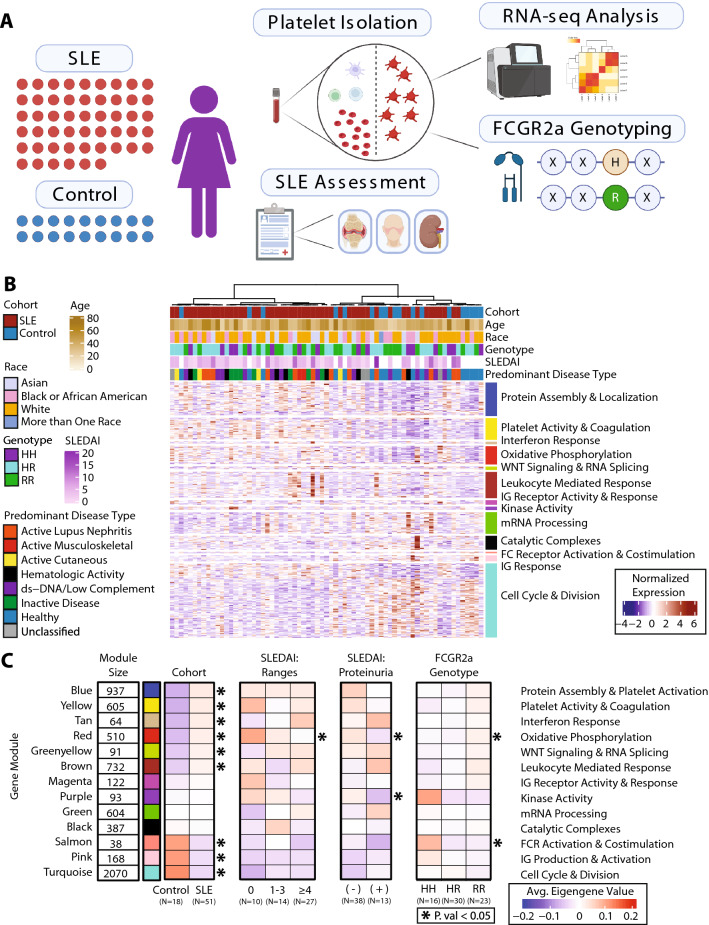
Fig. 1.
Initiation and Implementation of a Platelet Transcriptomic Modular Framework. A Schematic of the cohort and workflow. 51 SLE samples and 18 control samples were collected, and patients were assessed on SLE criteria and other baseline characteristics. Platelets were extracted from blood samples, and RNA-sequencing and FCGR2a genotyping was performed. B Heatmap of our RNA-seq cohort with samples along the x-axis and genes along the y-axis. Samples are annotated along the horizontal axis for cohort, age, race, FcγRIIA genotype, and SLEDAI and predominant disease category for SLE patients. Clustering of samples was performed using the top 20% of varied genes, the genes in the heatmap are those that composed the gene modules as determined by WGCNA. C Reduction of our RNA-seq cohort down to average eigengene values per subgroup. In order: The Cohort columns show the average eigengene value for patients in our Control subgroup and SLE subgroup. The SLEDAI Ranges columns show the average eigengene value for our SLE patients within each range of SLEDAI values (0, 1–3, ≥ 4). The SLEDAI Proteinuria columns show the average eigengene value for our SLE patients who have proteinuria (UPCR > 0.5) and those who do not. The FcγRIIA genotype columns show the average eigengene value for patients with each respective FcγRIIA genotype (HH, HR, RR). Cohort comparisons with a statistical test’s p value < 0.05 are denoted with an asterisk. Pairwise comparisons (Cohort, Proteinuria) were performed using a t-test and threeway comparisons (SLEDAI Ranges, FcγRIIA genotype) were performed using an ANOVA test

