Fig. 2.
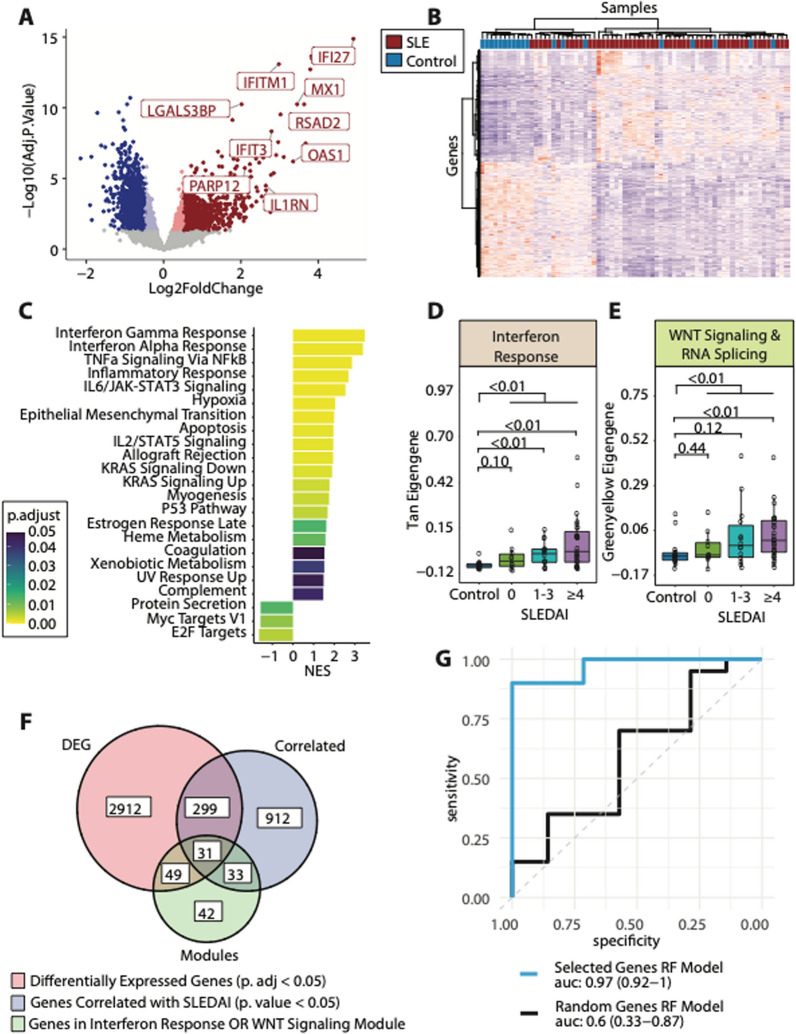
The Platelet Transcriptome is Significantly Different in SLE Subjects vs Controls. A Volcano plot of the differential expression between SLE subjects and controls. Red dots are upregulated genes with adjusted p. value < 0.05, dark red dots also pass a threshold of a log2foldchange > 0.5. Blue dots are downregulated genes with adjusted p. value < 0.05, dark blue dots also pass a threshold of a log2foldchange < -0.5. B Heatmap demonstrating unsupervised clustering of differentially expressed genes resulting in separation of our cohort by disease status. C Gene set enrichment analysis for the HALLMARK MSigDB pathways using the differentially expressed genes between our SLE and control cohort. The x-axis shows the normalized enrichment score (NES), and the color of the bar shows the adjusted p. value for the enrichment value. D Gene module scores for the Tan (interferon response) and the E Greenyellow (WNT Signaling and RNA splicing) modules across our entire cohort of patients. F Venn diagram of our feature selection process for genes to use in our machine learning model. We selected for genes that were differentially expressed (adjusted p. value < 0.05, red circle), genes with transcription correlated with SLEDAI values (p. value < 0.05, blue circle), and genes that belonged in either our Tan or Greenyellow modules (green circle). G ROC curves for a Random Forest model using our selected gene set [Blue line, AUC: 0.97 (0.92–1)] and a Random Forest model using a random equivalently sized gene set [Black line, AUC: 0.6, (0.33–0.87)]

