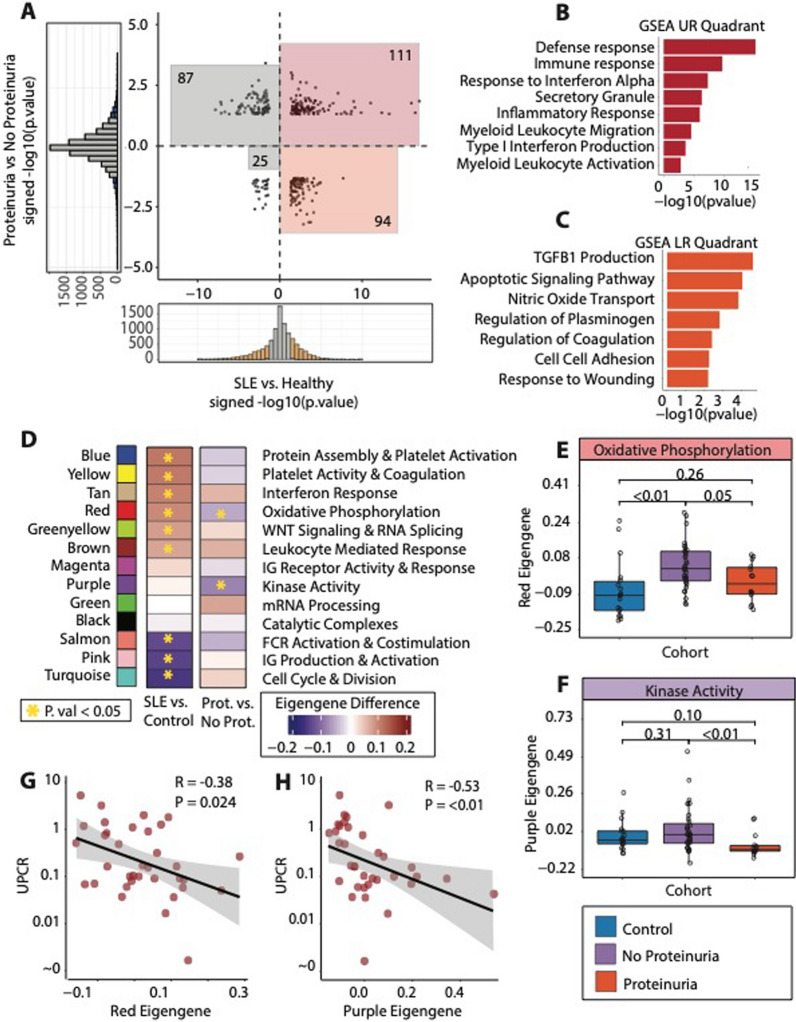
Fig. 3.
Lupus Subjects with Proteinuria have a distinct Transcriptome from a Generalized Lupus Signature A Scatterplot showing the signed -log10(p. value) values for the differential expression of SLE vs control (x-axis) and the differential expression of lupus patients with proteinuria vs lupus patients without proteinuria as defined by UPCR > 0.5. Genes in the red square are up in both SLE vs control, and proteinuria vs no proteinuria (N = 111), while genes in the orange square are up in SLE vs control, but down in proteinuria vs no proteinuria (N = 94). B Gene set enrichment analysis for genes that were up in SLE vs control and up in proteinuria vs no proteinuria. C Gene set enrichment analysis for genes that were up in SLE vs control and down in proteinuria vs no proteinuria. D Gene module framework with values demonstrating the difference in average module expression for SLE vs control, and proteinuria vs no proteinuria. Boxes annotated with a yellow star are those modules that were significantly different in their respective comparison. E Gene module scores for the Red (Oxidative Phosphorylation) and the E Purple (Kinase Activity) modules across our entire cohort of patients, annotated as controls, SLE patients with no proteinuria, or SLE patients with proteinuria. G, H are scatterplots comparing UPCR values vs the transcription of the Red and Purple gene modules

