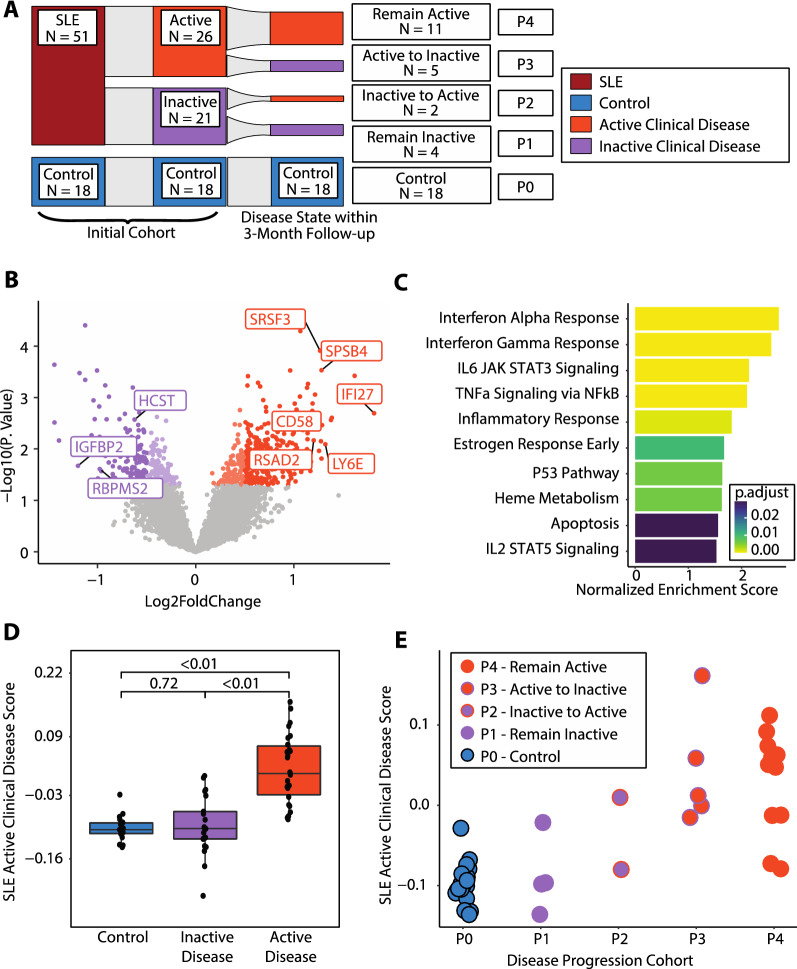
Fig. 5.
A Novel Platelet Transcriptomic Score associated with a change in Lupus Activity A Sankey diagram showing our cohort at the initial timepoint by disease status, active clinical disease status, and then active clinical disease status within 3 months of follow-up. Controls are P0, P1 are patients that remained inactive (N = 4), P2 are patients that had clinical flares of disease (N = 2), P3 are patients that improved disease activity (N = 4), and P4 are patients that remained active (N = 11). B Volcano plot for the differential expression between SLE patients with active clinical disease vs no active clinical disease. C GSEA for the differential expression of active clinical disease vs no active clinical disease. D SLE Active Clinical Disease Score for our cohort, divided into controls, and patients with inactive clinical disease and active clinical disease. E Scatterplot of patients showing a correlation between the disease progression cohort and the SLE Active Clinical Disease Score. Blue dots are control patients (P0), purple dots are patients with inactive disease at point of collection (P1), purple dots with orange outlines are patients who were inactive at collection, but transitioned to active clinical disease within 3 months (P2), orange dots with purple outlines are patients who with active clinical disease at baseline and transitioned to inactive clinical disease within 3 months (P3), and solid orange dots are patients with active clinical disease at the point of sample collection and remained active within the 3 month follow-up (P4)

