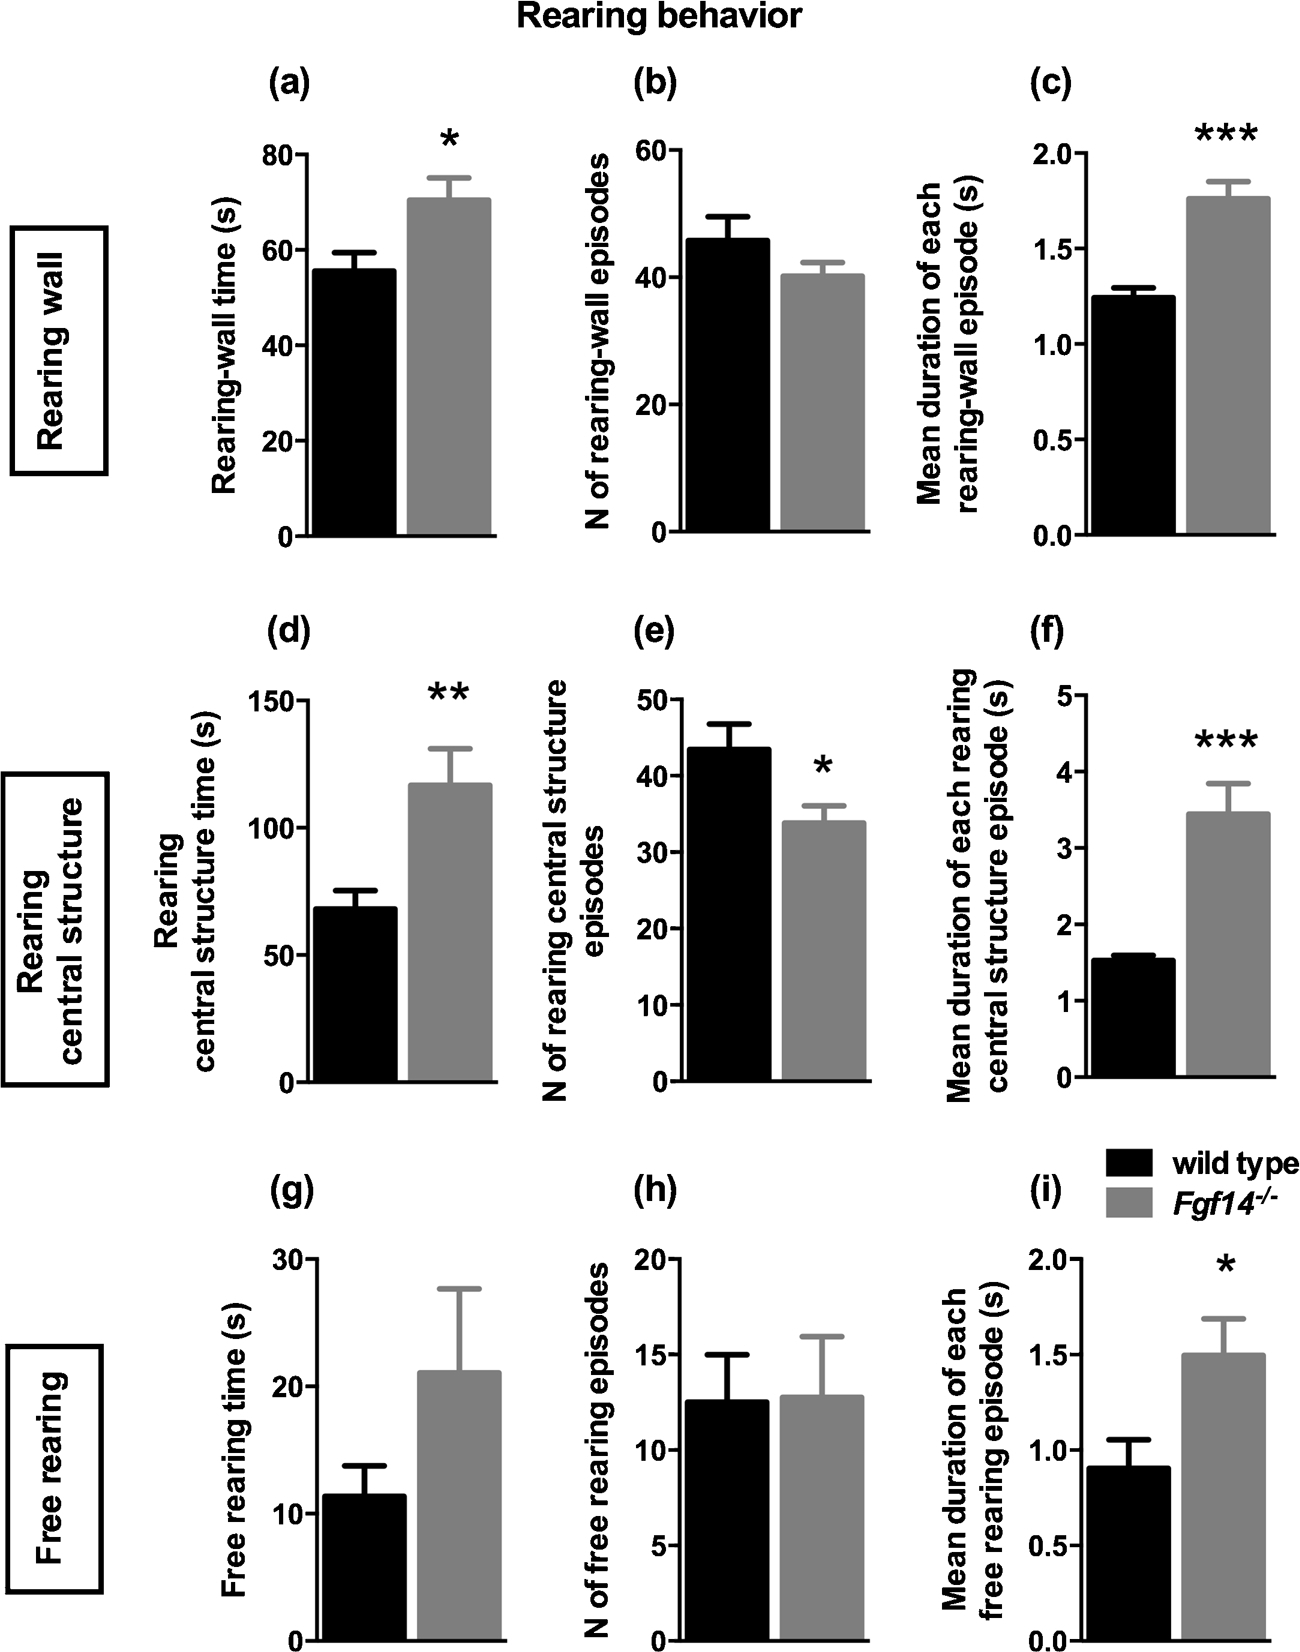
Fig. 2.

Rearing behavior observed in 10 min session. A–C. Rearing-wall behavior: Bars represent mean ± SEM of (A) rearing-wall time (p < 0.05), (B) number of episodes and (C) duration of each rearing-wall episode (p < 0.001). Rearing central structure behavior (D–F): (D) rearing-central structure time (p < 0.01), (E) number of episodes (p < 0.05) and (F) duration of each rearing-central structure episode (p < 0.001). Free rearing behavior (G–I): (G) free rearing time, (H) number of episodes and (I) duration of each free rearing episode of (p < 0.05).
