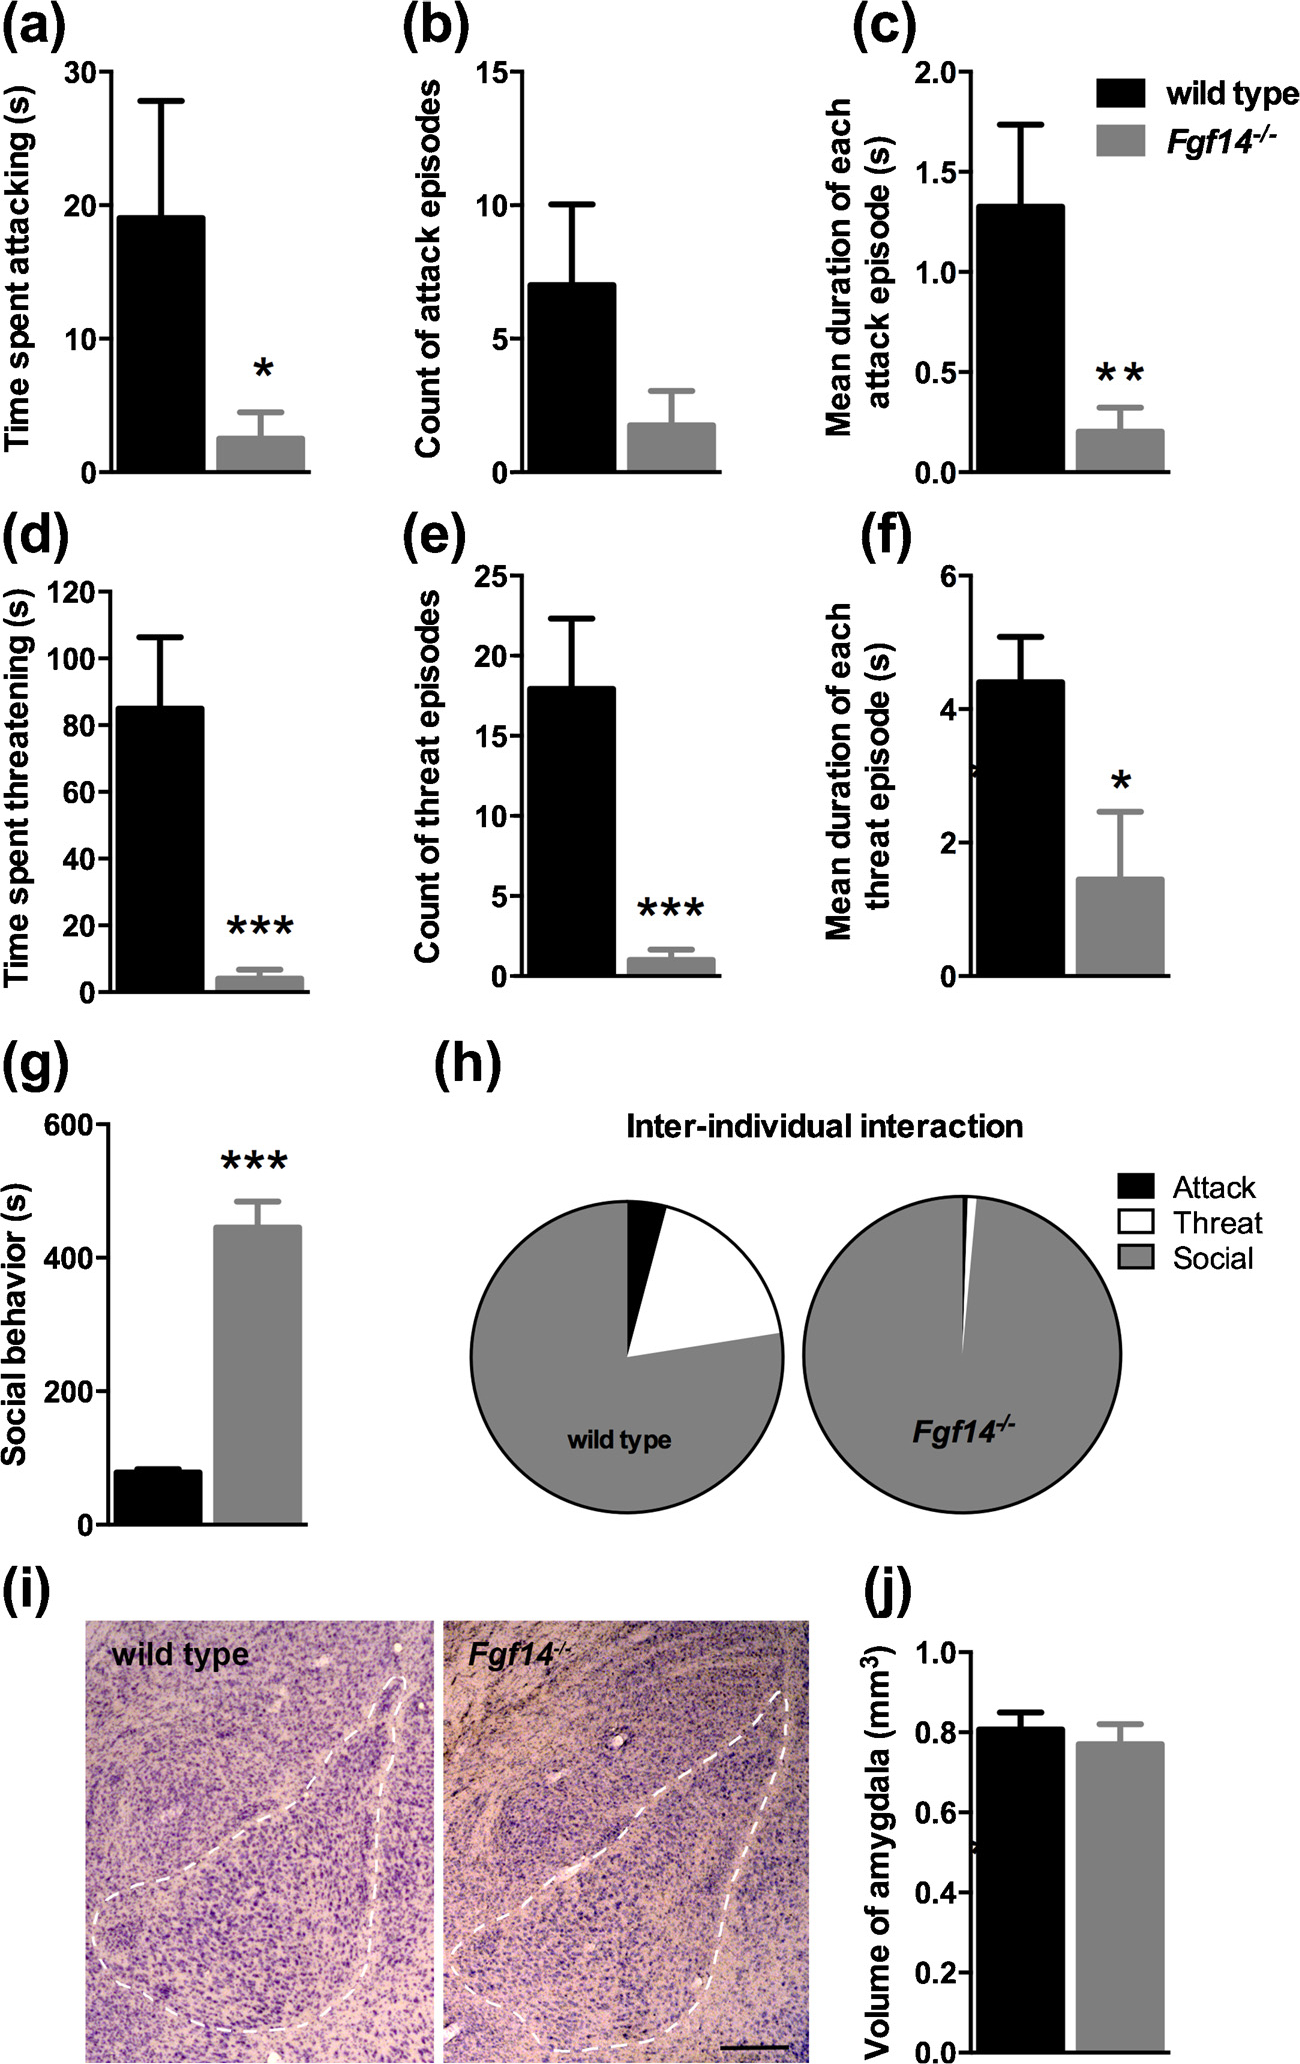
Fig. 7.

Fgf14−/− male mice show a reduced aggressivity in the resident intruder test. Bars represent means ± SEM of time (in seconds) spent in attack (a) and threat (d), number of episodes for attack (b) and threat (e), and mean duration of each episode for attack (c) and threat (f). (g) Duration of social behavior exhibited during the test. (h) Relative duration of inter-individual interaction types. (i) Representative Nissl-stained sections used to measure the size of the amygdala (calibration bar: 250 μm). (j) Volume of the amygdala in Fgf14−/− and wild type mice. The bars represent mean ± SEM. * p < 0.05; ** p < 0.01; *** p < 0.001.
