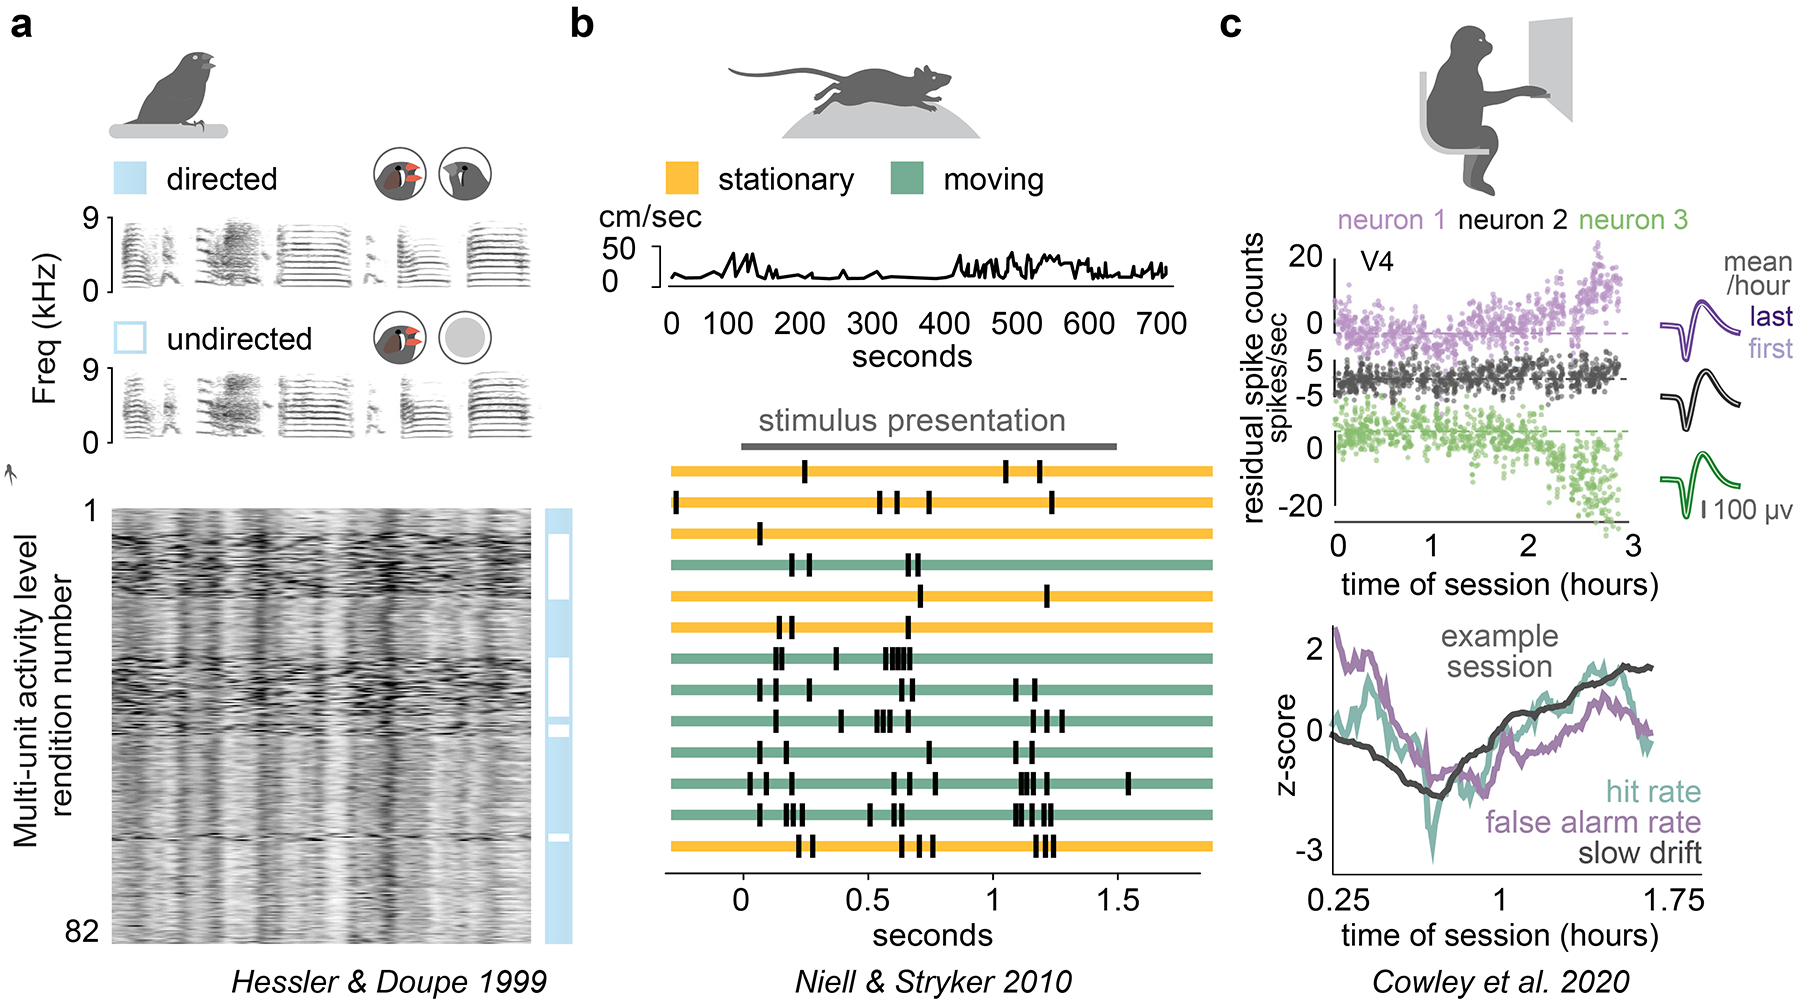
Figure 3. Behavioral and neural signatures of variability.

. (A) Zebrafinches sing to conspecifics of the opposite sex (directed song) as well as in isolation (non-directed song). While only small acoustic differences are evident between these contexts, the underlying neural activity shows striking variability72. Adapted with permission from Hessler and Doupe72. (B) Head-fixed mice on a spherical treadmill spontaneously alternate between a stationary state and locomotion. Responses to identical visual stimuli result in approximately two-times greater response when the mouse is running. Without quantification of behavioral state, this would appear as unexplained variance20,72. Adapted with permission from Niell and Stryker20. (C) In recordings of monkeys performing a visual task over several hours, task performance and arousal (as measured by pupil diameter) vary slowly. This is accompanied by a slow drift in the first principal component of neural activity, evident at the population level73. Adapted with permission from Cowley et al.73.
