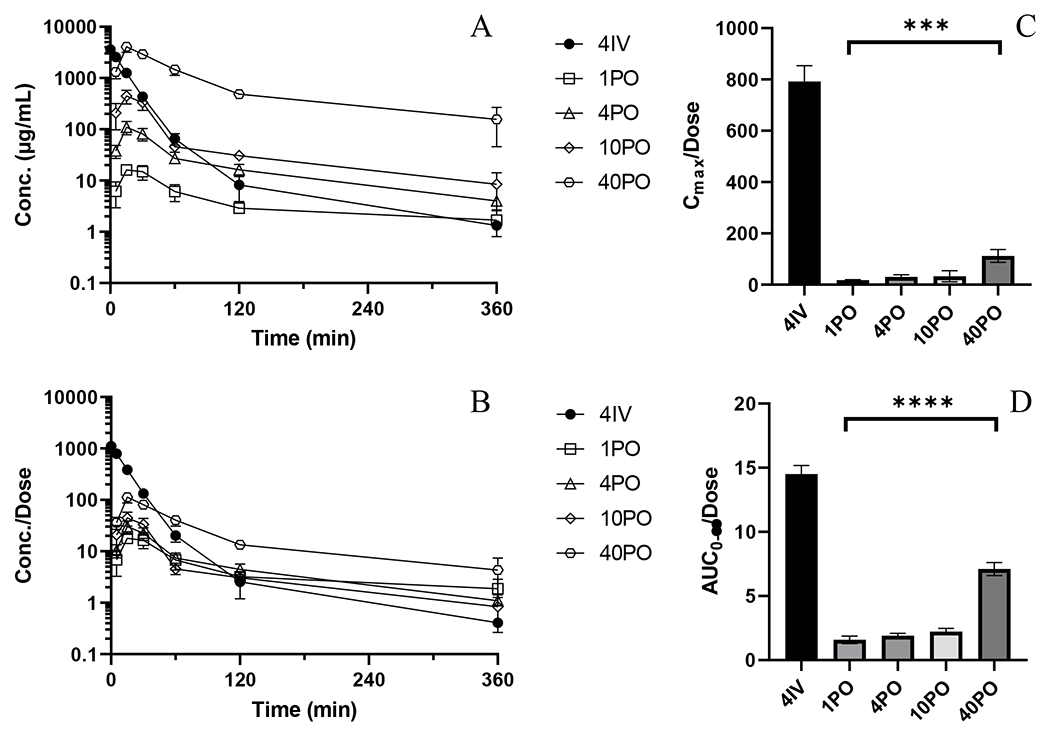
Figure 1.

PK and NCA of BAY-1895344 from bioavailability and dose linearity studies. A) Mean plasma concentration versus time profiles for 4IV (•), 1PO (○), 4PO (◇), 10PO (△), 40PO (□). B) Mean plasma concentrations normalized by administered dose versus time profiles C) Dose-normalized Cmax (ANOVA test of PO treated groups, p=0.0005) D) Dose-normalized AUC0-∞ (ANOVA test of PO treated groups, p<0.0001). Error bars represent ± SD for concentrations and ± SEM for AUC.
