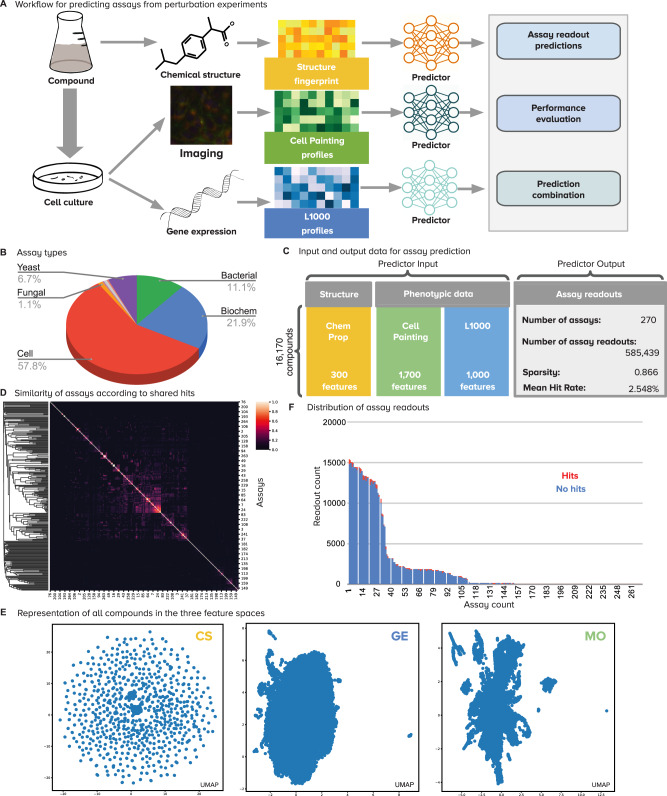
Fig. 1. Overview of the workflow and data.
A Workflow of the methodology for predicting diverse assays from perturbation experiments (more details in Supplementary Figs. 1 and 2). B Types of assay readouts targeted for prediction, which include a total of eight categories (Supplementary Fig. 15). C Structure of the input and output data for assay prediction. D Similarity of assays according to the Jaccard similarity between sets of positive hits. Most assays have independent activity (Supplementary Fig. 13). E UMAP visualizations of all compounds in the three feature spaces evaluated in this study (Supplementary Fig. 10). CS (yellow) Chemical Structure, GE (blue) Gene Expression, MO (green) Morphology. F Distribution of assay readouts for assays in the horizontal axis sorted by readout counts. The available examples follow a long tail distribution and the average ratio of positive hits to tested compounds (hit rate) is 2.548%.

