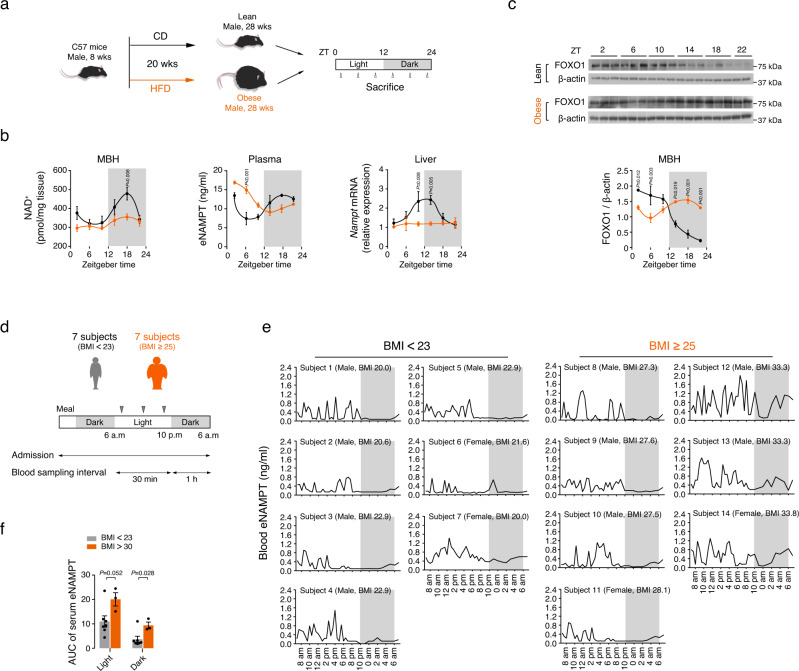
Fig. 7. Obesity disrupts the circadian rhythms of the blood eNAMPT–hypothalamic NAD+–FOXO1 axis.
a Schematic diagram of the obese mice study. b Disrupted circadian rhythms in hypothalamic NAD+ levels, plasma eNAMPT, and liver Nampt in obese mice fed a high-fat diet for 20 weeks (Lean, n = 3; Obese, n = 5 mice). Repeated measures ANOVA followed by Fisher’s LSD test. Two independent experiments were performed to validate the results. c Comparison of circadian rhythms in hypothalamic FOXO1 expression levels in lean and 20 weeks-HFD-fed obese mice (ZT22, n = 2; other groups, n = 3 mice). Repeated measures ANOVA followed by Fisher’s LSD test. Two independent experiments were performed to validate the results. Samples derive from the same experiment and that gels/blots were processed in parallel. d Schematic diagram of the human eNAMPT study. e The 24-h profiles of serum eNAMPT concentrations in young healthy volunteers [7 lean subjects with a body mass index (BMI) < 23 and 7 subjects with obesity, their BMI ≥ 25]. Note the lack of oscillation during the light-off period in lean subjects but the presence of significant oscillations in subjects with BMI > 30. f The area under the curve (AUC) of serum eNAMPT during light and dark periods in lean subjects with BMI < 23 and subjects with obesity (BMI > 30) (BMI < 23, n = 7, BMI > 30, n = 3). Unpaired t-test (two-sided). The shaded area in b, c, e represents the lights-off period. All data represent the mean ± SEM.

