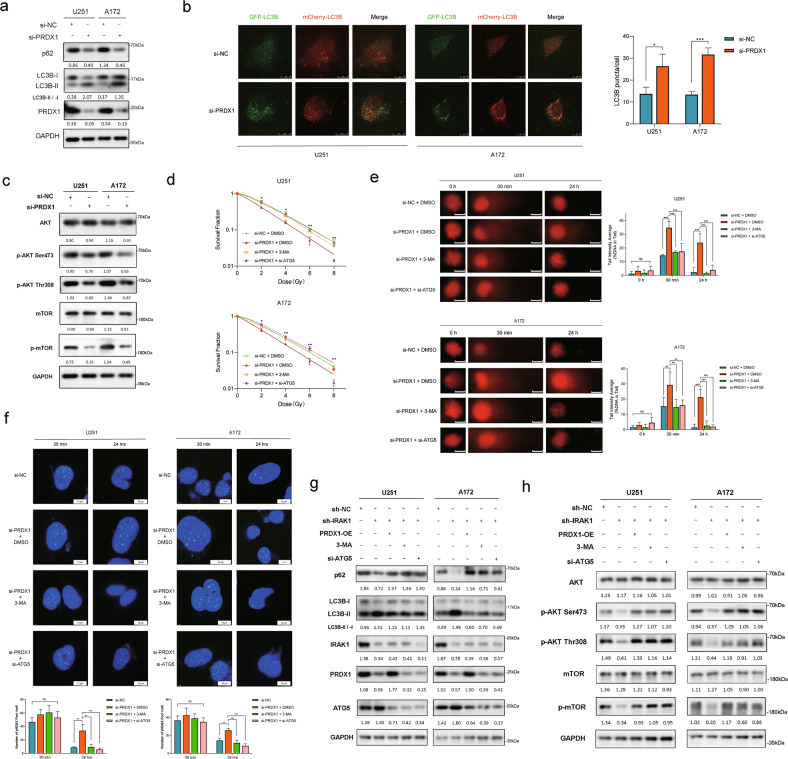
Fig. 7. PRDX1 silencing promotes the radiosensitivity of glioma cells via inducing autophagic cell death.
a The protein levels of p62, LC3B, and PRDX1 in U251 and A172 cells with PRDX1 knockdown were detected by Western blotting assay. b U251 and A172 cells with PRDX1 knockdown were transfected with mCherry-GFP-LC3B adenovirus for 48 h to assess autophagic flux by confocal microscopy, and the LC3B puncta was quantified. Scale bar, 10 μm. c The protein levels of Akt, p-Akt (Ser473), p-Akt (Thr308), mTOR, and p-mTOR were detected by Western blotting assay. d Survival fraction curves of U251 and A172 cells transfected with si-PRDX1 with or without 3-MA/siATG5 treatment (2.5 mM) 24 h before being exposed to 0, 2, 4, 6, 8 Gy of X-rays. e Representative images and quantitative analysis of comet tail in the indicated groups of U251 and A172 cells following 8 Gy IR. Scale bar, 10 μm. f Cells were transfected with si-PRDX1 or si-NC for 24 h and then treated with 3-MA (2.5 mM) or transfected with si-ATG5 plasmids for another 24 h before being exposed to 8 Gy X-rays. Typical images and the quantification analysis of γ-H2AX foci were presented. Scale bar, 10 μm. IRAK1 silencing U251 and A172 cells were transfected with PRDX1-OE plasmids, si-ATG5 plasmids, or treated with 3-MA (2.5 mM, 24 h). The protein levels of p62, LC3B (g), Akt, p-Akt (Ser473), p-Akt (Thr308), mTOR, and p-mTOR (h) were detected via Western blotting. Positions of LC3-I and LC3-II are indicated. The LC3-II/LC3-I ratio was calculated based on densitometry analysis of both bands. The gray value ratios of other proteins/GAPDH were shown below each lane. Data were presented as the mean ± SD; n = 3 independent experiments. *p < 0.05, **p < 0.01, ***p < 0.001.

