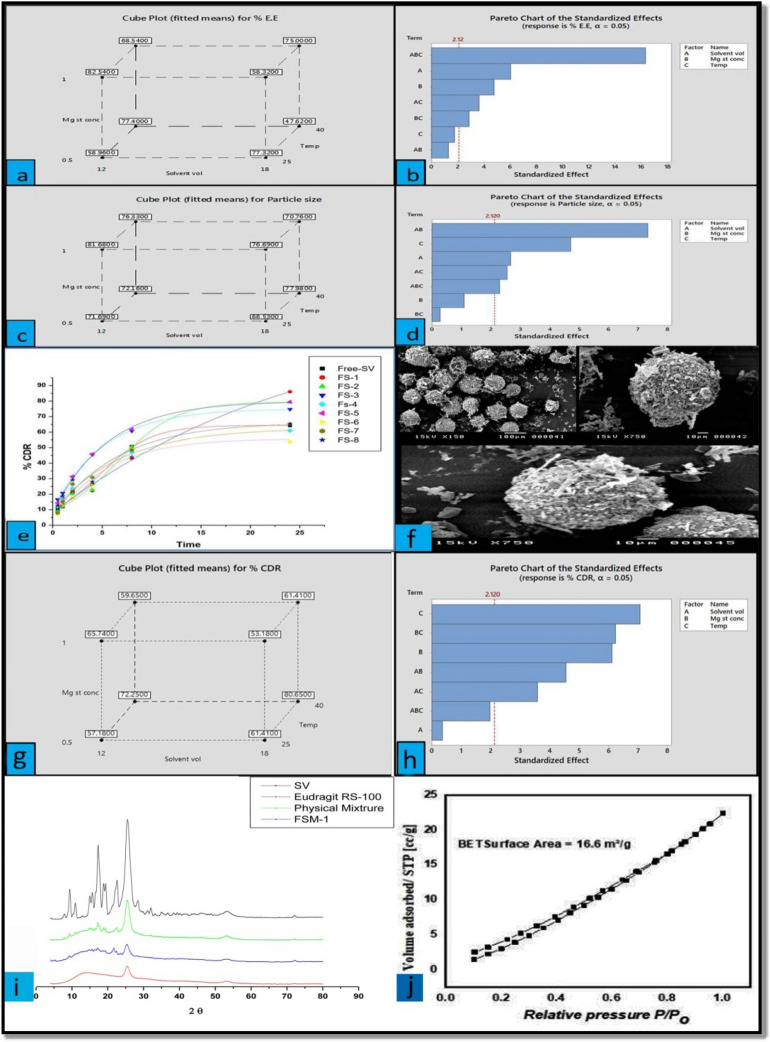
Figure 1.
(a) Cube plot (fitted means) for %EE. (b) Pareto chart of standardized effects (response is %EE. (c) Cube plot (fitted means) for particle size. (d) Pareto chart of standardized effects (response is particle size). (e) In vitro release profile of SV from different micrsoponges formulations and free SV dispersion. (f) Cube Plot (fitted means) for % CDR. (g) Pareto chart of standardized effects: response is %CDR. (h) SEM of optimized formulation of SV microsponges. (i) X-ray diffraction pattern for SV, Eudragit-RS-100, Physical mixture, and FSM-1. (j) N2 adsorption–desorption hysteresis of FSM-1.

