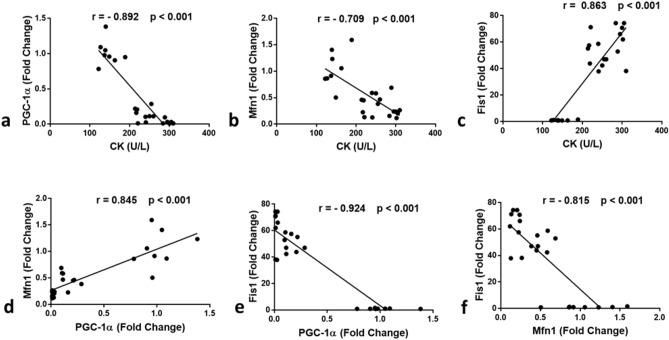
Figure 6.
Correlation between (a) CK and PGC-1α; (b) CK and Mfn1; (c) CK and Fis1; (d) PGC-1α and Mfn1; (e) PGC-1α and Fis1; (f) Mfn1 and Fis1. Significant positive correlation was found between (c) CK and Fis1 (r = 0.863, P < 0.001), (d) PGC-1α and Mfn1 (r = 0.845, P < 0.001). On the other hand, significant negative correlation was found (a) CK and PGC-1α (r = − 0.892, P < 0.001), (b) CK and Mfn1 (r = − 0.709, P < 0.001), (e) PGC-1α and Fis1 (r = − 0.924, P < 0.001), (f) Mfn1 and Fis1 (r = − 0.815, P < 0.001). r: Pearson correlation factor. The Correlations are analyzed between the studied parameters in the control, Free SV, and FSM-1 groups (n = 24).

