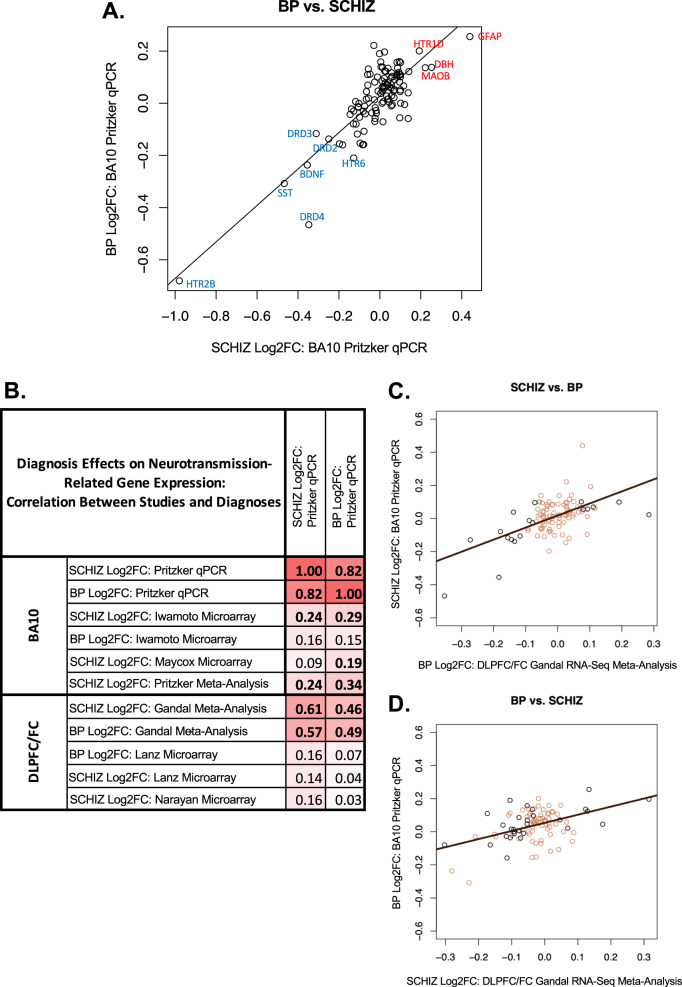
Fig. 4. Cross-diagnosis comparison: BP and SCHIZ have similar differential expression in BA10 and adjacent cortex.
A A scatterplot illustrating the correlation between the differential expression (Log2FC) for BP vs. SCHIZ for the 111 target genes included in our two BA10 qPCR datasets. In general, there is a strong positive correlation between the effects of the two diagnoses (R = 0.82, P < 2e-16). Data points are labeled with official gene symbols for individual genes with particularly large Log2FC for both diagnoses. B A table of correlation coefficients illustrating the similarity between the differential expression (Log2FC) associated with BP and SCHIZ in BA10 in our qPCR study and the differential expression (Log2FC) associated with both BP and SCHIZ in BA10 as measured by microarray (re-analyzed by our laboratory: Iwamoto et al. [20] and Maycox et al. datasets [21]) and in the DLPFC/FC as indicated by the large Gandal et al. meta-analysis of RNA-Seq studies [34] or by two smaller DLPFC microarray studies that used grey matter-focused dissections (Lanz et al. [36] and Narayan et al. [35]). Bold text indicates significance (P < 0.05). C, D Scatterplots illustrating the cross-diagnosis correlation between the effects of BP and SCHIZ within our BA10 qPCR dataset (Log2FC) and the effects of BP and SCHIZ within the results from the large DLPFC/FC Gandal et al. RNA-Seq meta-analysis [34] (Log2FC) for all genes that were present in both datasets (95 genes). The color of the data points signifies whether a gene showed a nominally significant effect of diagnosis in the DLPFC/FC Gandal et al. RNA-Seq meta-analysis results (black: P < 0.05, brown: P > 0.05). These findings indicate that the similarity between the effects of BP and SCHIZ within our BA10 qPCR dataset is not just an artifact due to using the same CTRL group as a reference in our analysis, but a valid property of the diagnosis-related differential expression. Full statistical reporting for the correlations between the differential expression observed in association with different diagnoses and different datasets can be found in Supplementary Table S9.

