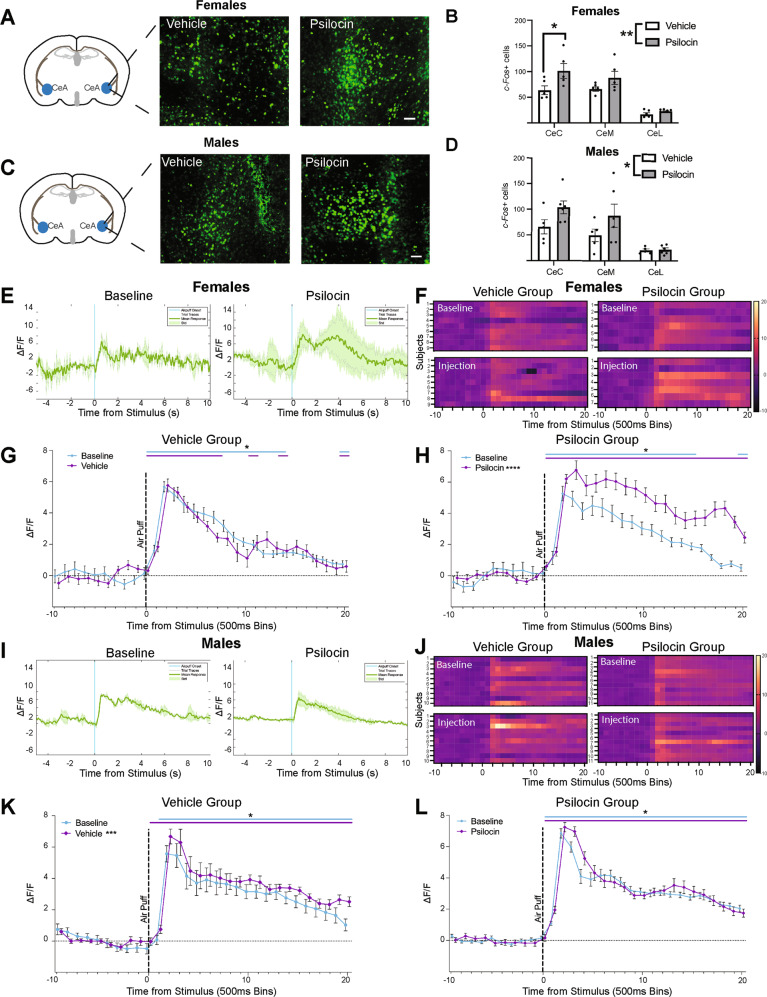
Fig. 2. Acute changes in CeA reactivity in response to an aversive air-puff stimulus following psilocin administration.
A Females: representative images showing c-Fos+ cells tagged with a green fluorescence protein (GFP) in the CeA. Scale bar = 100 μm. B Female vehicle vs. psilocin: histogram showing the number of c-Fos+ cells in each subregion of the CeA. CeC capsular CeA, CeM Medial CeA, CeL lateral CeA. Data points correspond to the mean of 2–4 hemispheres for each individual subject. C Males: representative images showing c-Fos+ cells tagged with a green fluorescence protein (GFP) in the CeA. Scale bar = 100 μm. D Male vehicle vs. psilocin: histogram showing the number of c-Fos+ cells in each subregion of the CeA. CeC capsular CeA, CeM medial CeA, CeL lateral CeA. Data points correspond to the mean of 2–4 hemispheres for each individual subject. E Female psilocin group: representative raw ΔF/F traces showing an individual at baseline and while on psilocin. Blue line = air-puff onset, Gray lines = individual traces, Green line = mean trace, Std standard deviation. F Females: Heatmaps comparing baseline to injection. Each row represents an individual subjects mean trace. G Female vehicle group: air-puff trace plots of changes in CeA fluorescence following exposure to a 500 ms air-puff at 85 psi. Data points represent group averages within 500 ms binned window +/− S.E.M. H Female psilocin group: air-puff trace plots of changes in CeA fluorescence following exposure to a 500 ms air-puff at 85 psi. Data points represent group averages within 500 ms binned window +/− S.E.M. I Male psilocin group: representative raw ΔF/F traces showing an individual at baseline and while on psilocin. Blue line = air-puff onset, Gray lines = individual traces, Green line = mean trace, Std standard deviation. J Males: Heatmaps comparing baseline to injection. Each row represents an individual subjects mean trace. K Male vehicle group: air-puff trace plots of changes in CeA fluorescence following exposure to a 500 ms air-puff at 85 psi. Data points represent group averages within 500 ms binned window +/− S.E.M. L Male psilocin group: air-puff trace plots of changes in CeA fluorescence following exposure to a 500 ms air-puff at 85 psi. Data points represent group averages within 500 ms binned window +/− S.E.M. In each trace bin plot panel, a significant increase in ΔF/F was determined whenever the lower bound of the 99% CI was >0. These points of statistical significance are shown as colored lines above each ΔF/F curve with colors corresponding to the respective binned traces with a * above the lines. *p < 0.05, **p < 0.01, ***p < 0.001, ****p < 0.0001.

