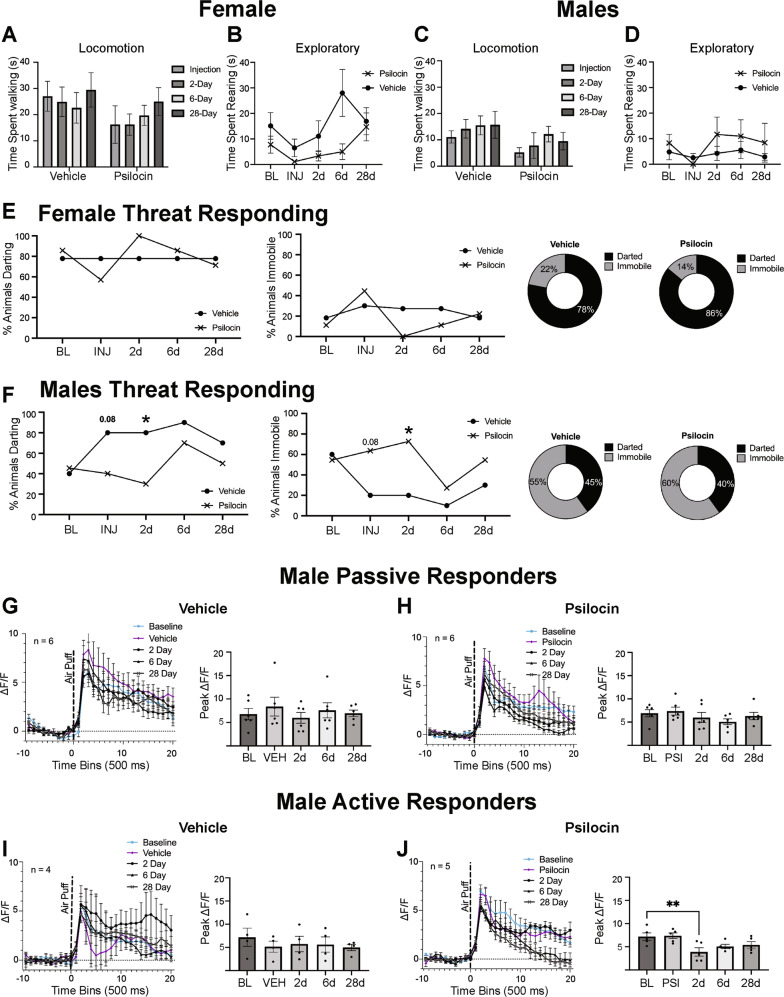
Fig. 4. Acute and Prolonged Behavioral Effects of Psilocin.
A Females: locomotion plots comparing vehicle and psilocin groups at each time point. Data points are mean time in seconds +/− S.E.M. B Females: time spent rearing comparing vehicle and psilocin groups at each time point. Data points are mean time in seconds +/− S.E.M. C Males: locomotion plots comparing vehicle and psilocin groups at each time point. Data points are mean time in seconds +/− S.E.M. D Males: time spent rearing comparing vehicle and psilocin groups at each time point. Data points are mean time in seconds +/− S.E.M. E Females threat responding behavior. First figure is showing percentage of subjects that darted following air-puff administration. Second figure is showing the percentage of animals that remained immobile following air-puff. Third and fourth figure are pie charts showing the percentage of animals that darted vs. remained immobile F Males threat responding behavior: First figure is showing percentage of subjects that darted following air-puff administration. Second figure is showing the percentage of subject that remained immobile following air-puff. Third and fourth figure are pie charts showing the percentage of animals that darted vs. remained immobile. G Male vehicle passive responders (remained immobile) group: First figure shows air-puff trace plots of changes in CeA fluorescence following exposure to a 500 ms air-puff at 85 psi. Data points represent group averages within 500 ms binned window +/− S.E.M.; second figure is a histogram showing differences in the mean peak ΔF/F value for each group +/− S.E.M following air-puff administration. Data points reflect each individual subject within the corresponding subgroup. H Male psilocin passive responders (remained immobile) group: First figure shows air-puff trace plots of changes in CeA fluorescence following exposure to a 500 ms air-puff at 85 psi. Data points represent group averages within 500 ms binned window +/− S.E.M. Second figure is a histogram showing differences in the mean peak ΔF/F value for each group +/− S.E.M following air-puff administration. Data points reflect each individual subject within the corresponding subgroup. I Male vehicle active responders (darted) group: First figure shows air-puff trace plots of changes in CeA fluorescence following exposure to a 500 ms air-puff at 85 psi. Data points represent group averages within 500 ms binned window +/− S.E.M. Second figure is a histogram showing differences in the mean peak ΔF/F value for each group +/− S.E.M following air-puff administration. Data points reflect each individual subject within the corresponding subgroup. J Male psilocin active responders (darted) group: First figure shows air-puff trace plots of changes in CeA fluorescence following exposure to a 500 ms air-puff at 85 psi. Data points represent group averages within 500 ms binned window +/− S.E.M. Second figure is a histogram showing differences in the mean peak ΔF/F value for each group +/− S.E.M following air-puff administration. Data points reflect each individual subject within the corresponding subgroup. *p < 0.05, **p < 0.01.

