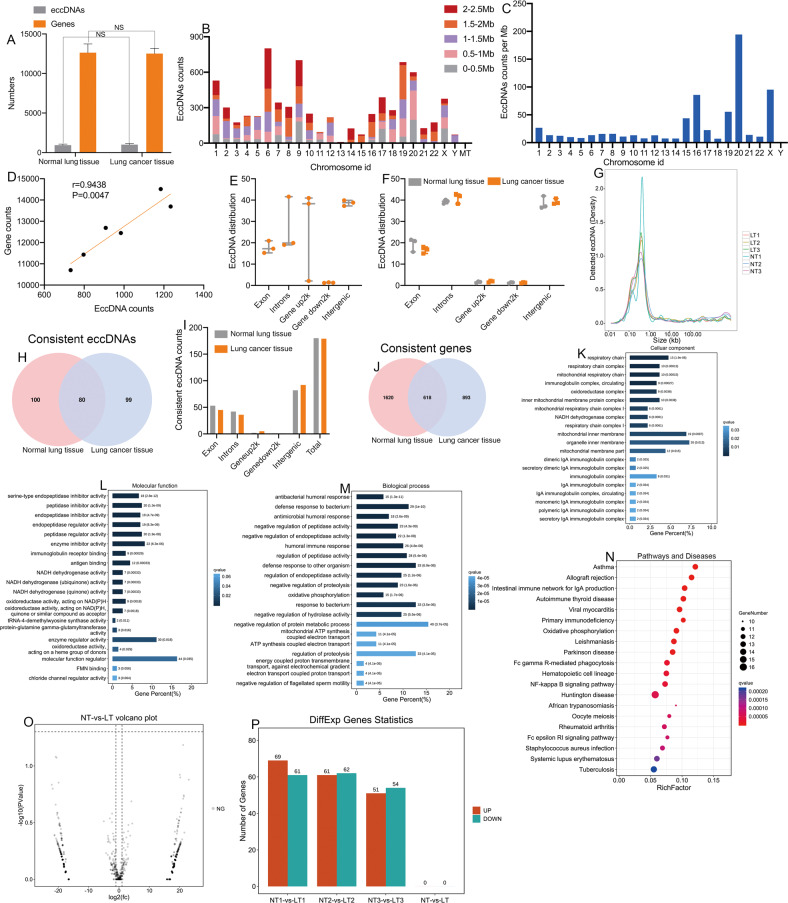
Fig. 1. Genome-wide detection and analysis of eccDNA distribution by high-throughput sequencing in matched NSCLC and normal samples.
A The number of eccDNA types and involved genes from normal and NSCLC tissues. B The distribution of eccDNAs in the 23 pairs of chromosomes. C The eccDNA frequency per Mb in each chromosome. D There was a significant correlation between the number of coding genes in a given chromosome and the number of eccDNAs derived from the chromosome (P = 0.047). E, F The distribution of eccDNAs in different classes of genomic regions. G The length distribution of eccDNAs ranged from 0.01 kb to 1000 kb. H A Venn diagram showing the consistent eccDNAs detected in the NSCLC and matched normal lung tissue samples. I The distribution of consistent eccDNAs in different classes of genomic regions. J A Venn diagram showing the consistent genes detected in the NSCLC and matched normal lung tissue samples. K–M The cellular components, molecular functions, and biological processes associated with the consistent eccDNAs. N KEGG pathway analysis of the consistent eccDNAs between NSCLC and matched normal lung tissue. O, P Volcano plot and histogram showing that there were no differentially expressed eccDNAs between NSCLC and matched normal lung tissues. EccDNA extrachromosomal circular DNA, NSCLC non-small cell lung cancer, Mb megabase.

