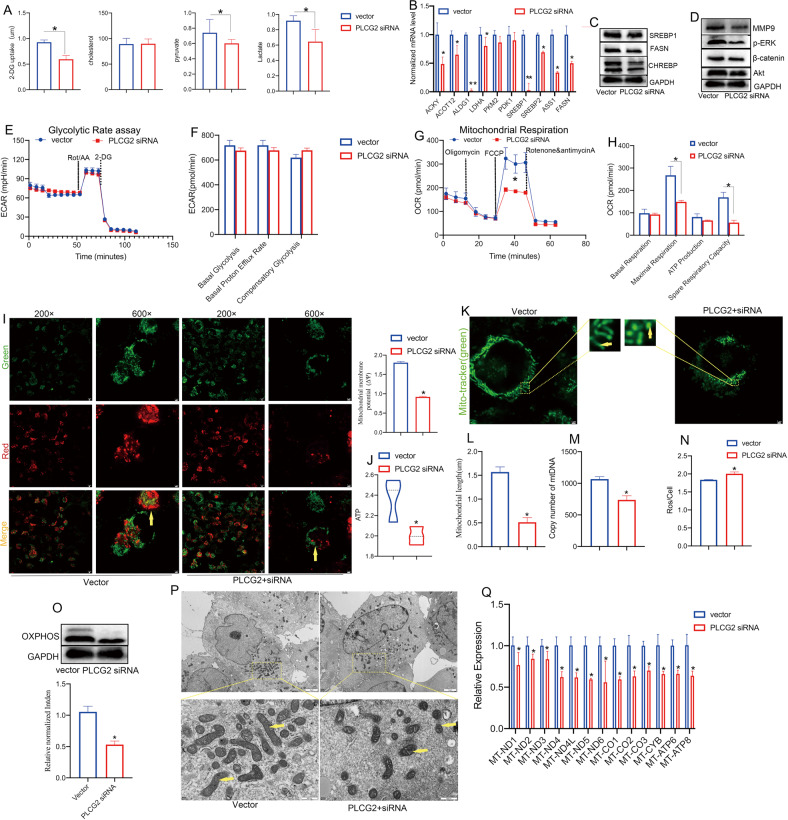
Fig. 5. PLCG2 knockdown induced mitochondrial dysfunction by regulating the ETC.
A Glucose uptake, cholesterol, pyruvate and lactate production in H1299 cells after PLCG2 siRNA transfection. B, C The expression of metabolism-related genes in H1299 cells after PLCG2 siRNA transfection by qPCR and western blotting. D The levels of the metabolic reprogramming-related β-catenin/Akt signaling pathway components in H1299 cells after PLCG2 siRNA transfection, as shown by western blotting. E–H The glycolytic rate and mitochondrial respiration of H1299 cells after PLCG2 siRNA transfection, as determined by Seahorse XF. I The mitochondrial membrane potential (MMP, ΔΨ) of H1299 cells after PLCG2 siRNA transfection by JC-1 staining. Scale bar = 600×. J Mitochondrial ATP synthesis in the PLCG2 siRNA group by the ATP detection kit. K, L The length of mitochondria in the PLCG2 siRNA group by MitoTracker Green staining and ImageJ software. M The number of mitochondria in the PLCG2 siRNA group as determined by mtDNA copy number count. N The production of reactive oxygen species (ROS) in the PLCG2 siRNA group. O The OXPHOS components in the PLCG2 siRNA group by western blotting. P Morphological changes in mitochondria in the PLCG2 siRNA group by TEM. Q The expression of ETC-related genes in the PLCG2 siRNA group by qPCR. Representative results from at least three independent experiments are shown. Data are represented as the mean ± SD of at least three experiments and statistically analyzed by Student’s t test or one-way ANOVA. *P < 0.05.

