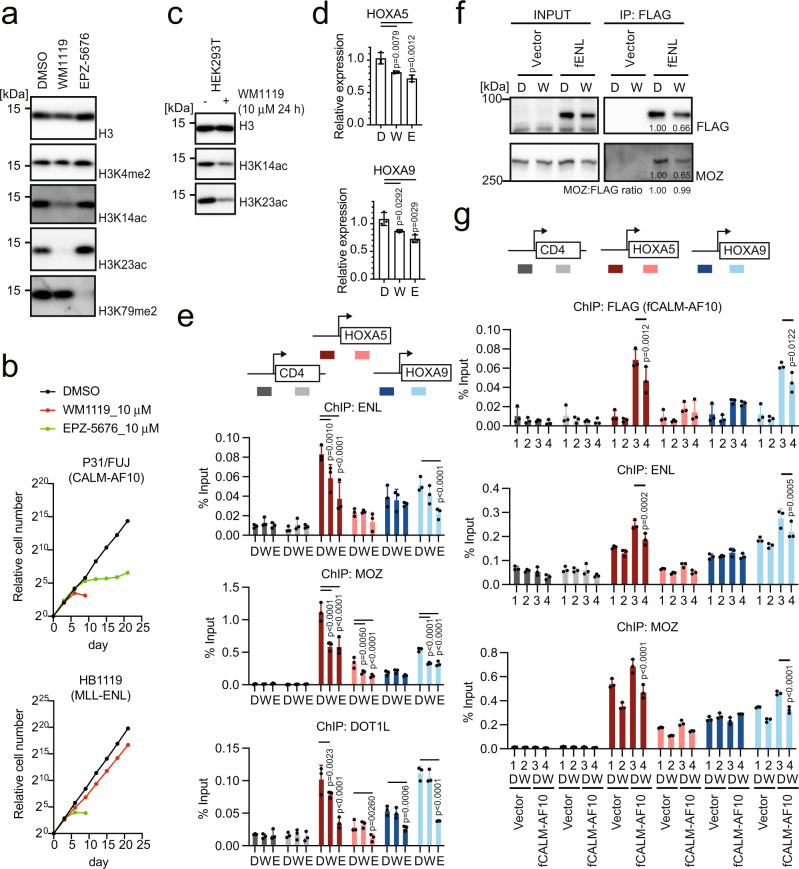
Fig. 5. MOZ/MORF-mediated acetylation is required for the localization of the MOZ/ENL complex and CALM-AF10 at the target chromatin.
a Histone modifications in CALM-AF10 leukemia cells after treatment with MOZ/MORF KAT (WM1119) and DOT1L KMT (EPZ-5676) inhibitors. WB of the P31/FUJ cells treated with 10 µM of WM1119 or EPZ-5676 for 6 days using antibodies specific to each histone modification. b Leukemia cell proliferation in the presence of WM1119 and EPZ-5676. P31/FUJ cell proliferation in the presence of 10 µM WM1119 or EPZ-5676 was monitored for 21 days along with the vehicle control (DMSO). c Histone modifications in HEK293T cells after treatment with WM1119. WB of the HEK293T cells treated with 10 µM of WM1119 for 24 h using antibodies specific to each histone modification. d HOXA gene expression in HEK293T cells after treatment with WM1119 and EPZ-5676. RT-qPCR of the HEK293T cells treated with 10 μM of WM1119 (W), EPZ-5676 (E), or DMSO control (D) for 5 days (mean ± SD of technical replicates, n = 3). Multiple comparisons were performed using a one-way ANOVA. e Localization of ENL, MOZ, and DOT1L after treatment with WM1119 and EPZ-5676. ChIP-qPCR of HEK293T cells treated with 10 µM of WM1119 or EPZ-5676 for 5 days was performed as in Fig. 2d (mean ± SD of technical replicates, n = 3). Multiple comparisons were made using a two-way ANOVA. f Effects of WM1119 on protein interactions in ENL. IP-WB of the chromatin fraction of HEK293T cells stably expressing various FLAG-tagged ENL constructs with (W: WM1119) or without (D: DMSO control) the treatment with WM1119 at 10 µM for 5 days was performed. The co-precipitates were analyzed using anti-FLAG and MOZ antibodies. The relative band intensity was quantified using the Image J software. g Localization of CALM-AF10 after treatment with WM1119. HEK293T cells stably expressing FLAG-tagged CALM-AF10 (fCALM-AF10) were treated with 10 µM WM1119 (W) or the DMSO control (D) for 5 days and subjected to ChIP-qPCR analysis as in Fig. 2d (mean ± SD of technical replicates, n = 3). Multiple comparisons were performed using a two-way ANOVA. Source data are provided as a Source Data file.

