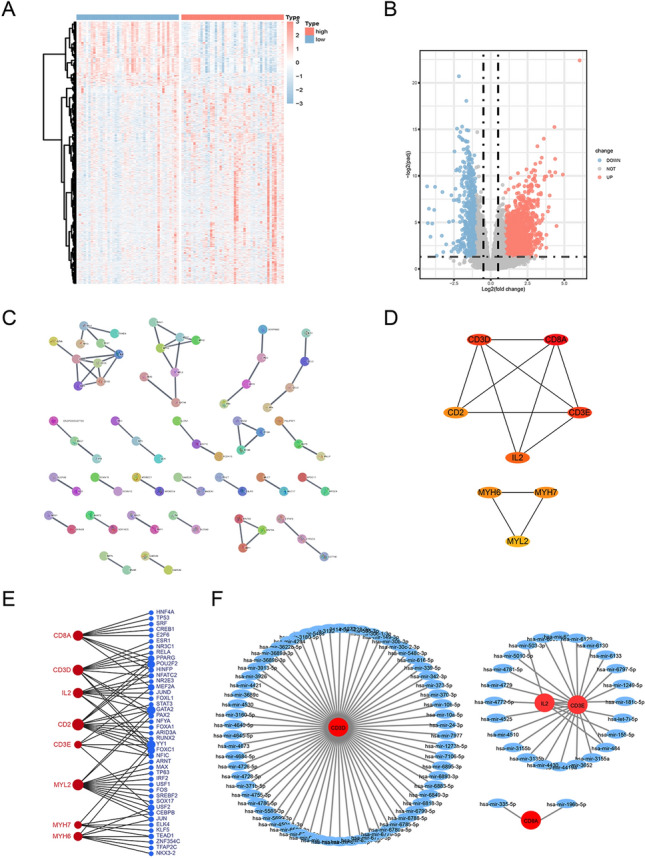
Figure 8.

Differentially expressed genes (DEGs) of high- and low-risk groups and regulatory network construction of hub genes. (A,B) Volcano plots and heatmaps of DEGs according to high- and low-risk scores. (C) The DEGs’ protein–protein interaction network was developed using STRING. (D) Hub genes were identified using the CytoHubba algorithm. (E) Transcription factor regulatory networks of 8 hub genes. (F) miRNA regulatory networks of the hub genes.
