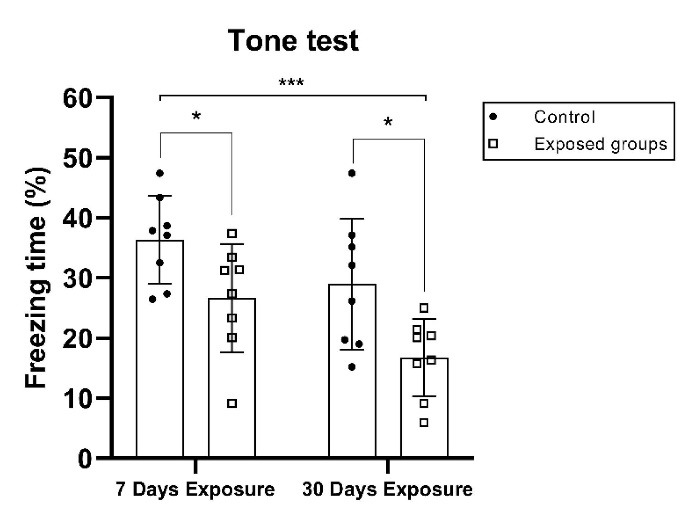
Figure 2.

Mean Percentage of Freezing to Context and Tone Data Following a 24-Hour Contextual Fear Conditioning Test (tone: 4000 Hz, 90 dB, 30 s; foot shock: 0.5 mA, 2 s). The freezing time of the control and EMF exposure groups was monitored, recorded, and evaluated by the software application. All data are presented as mean ± SD and were analyzed using one-way and two-way ANOVA (comparing between all groups) or Student’s t test to compare the short-term group and its control group, and the long-term group and its control group; ns = not significant; *P < 0.05 and ***P < 0.001.
