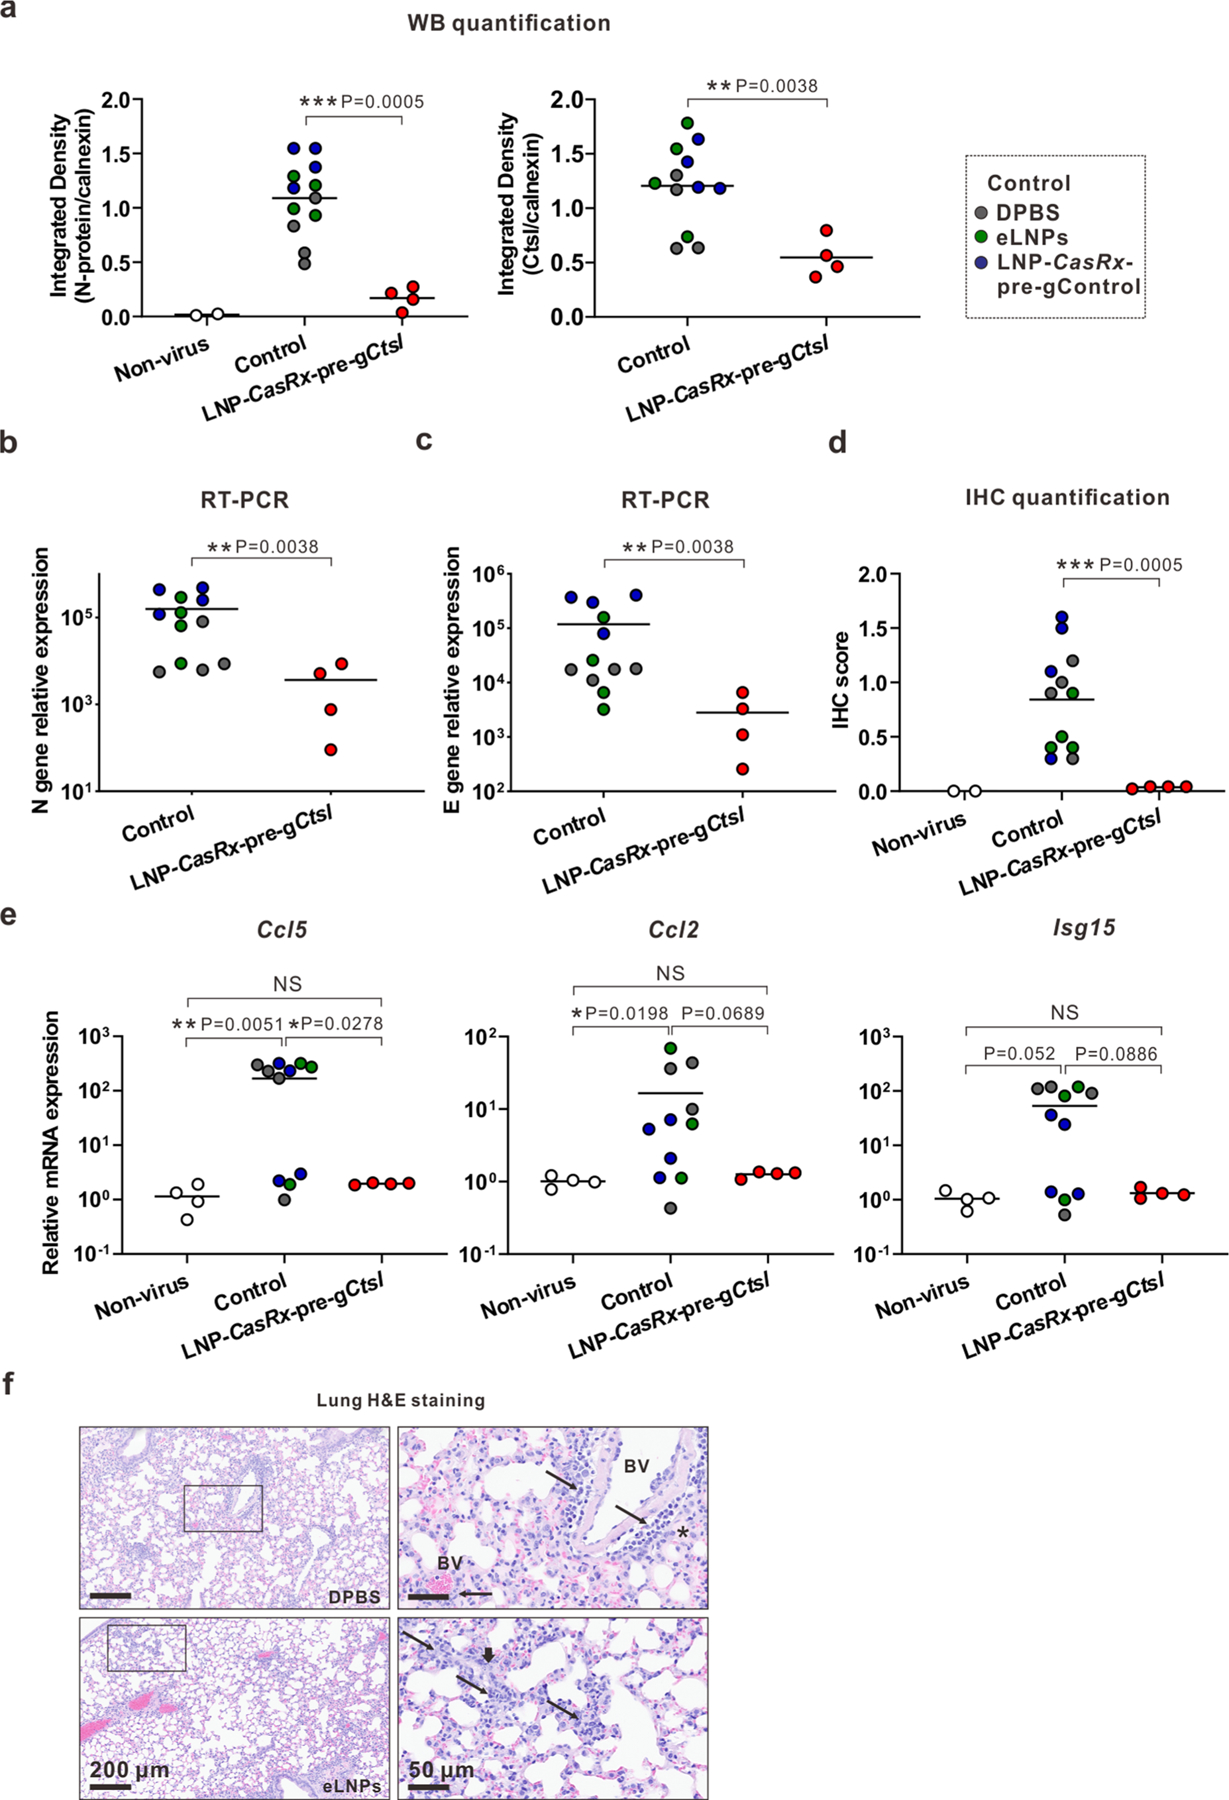
Extended Data Fig. 6 |. CasRx-mediated Ctsl knockdown reduces viral burden and chemokines/cytokines in lungs of K18-hACE2 mice on Day 2 or 4 after SARS-CoV-2 infection.

The experimental designs are same as in Fig. 4a. or 5a, respectively. a, Integrated density of N protein (left panel) and Ctsl (right panel) over the loading control on 2 DPI. b, Viral N gene transcript level on 2 DPI. c, Viral E gene transcript level on 2 DPI. d, IHC score for N protein on 2 DPI. e, Ccl5, Ccl2 and Isg15 transcript levels on 4 DPI. b, c, e, All transcript levels were determined by RT-PCR and normalized to Gapdh. P values were calculated by one-tailed Mann-Whitney U test, grand mean. NS, not significant, * P < 0.05, ** P < 0.01. f, Representative photomicrographs of H&E-stained lung sections for the controls of DPBS and eLNPs on 4 DPI. Annotations: BV, blood vessel; thin arrow, perivascular or interstitial inflammatory infiltrates; thick arrow, karyorrhexic nuclei and region of diffuse alveolar damage; asterisk, intra-alveolar edema.
