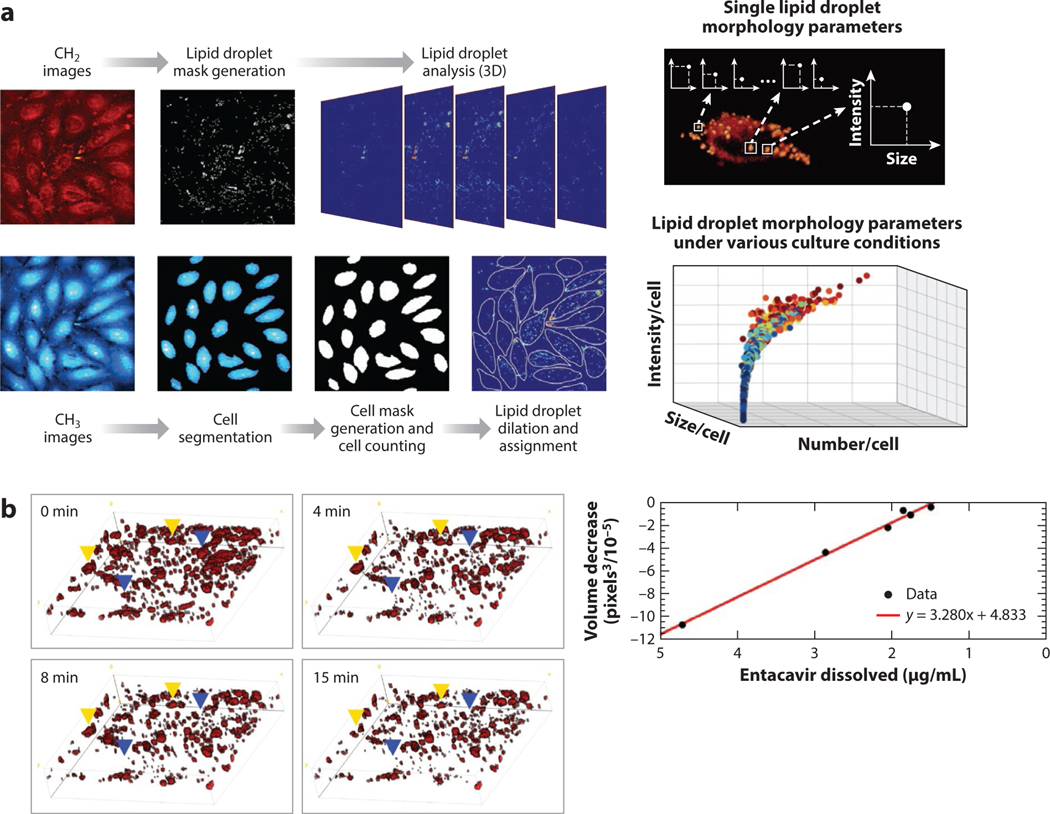
Figure 2.
Quantitative morphological analysis through SRS microscopy. (a) Imaging scheme and workflow of lipid droplet imaging and analysis based on lipid droplet size, number, and intensity. (Left) Representative images of lipid signal (CH2), protein signal (CH3), the respective lipid droplet masks, and cell masks created are shown left. (Right) The distribution of measured lipid droplet parameters across all cell images are shown right. Panel adapted with permission from Reference 66; copyright 2016 American Chemical Society. (b) Representative time-lapse images of entecavir within a polymer matrix dissolving into solution (left) and the correlation between measured volume decrease and dissolved entecavir (right). Panel adapted with permission from Reference 68; copyright 2018 American Chemical Society. Abbreviations: 3D, three-dimensional; SRS, stimulated Raman scattering.

