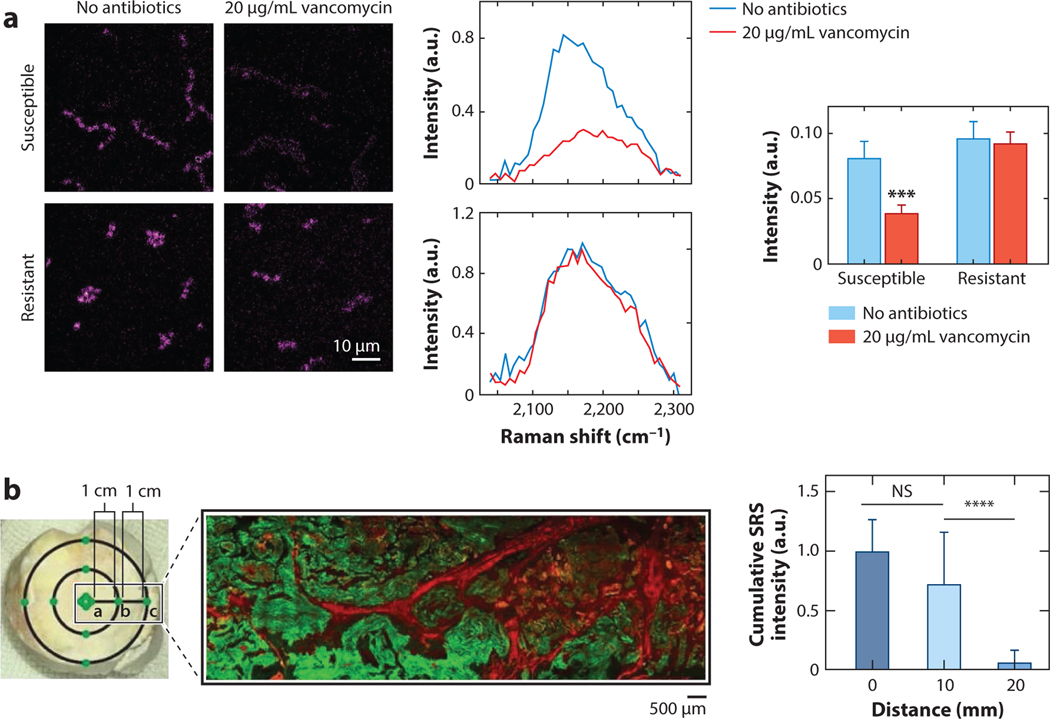
Figure 3.
Relative concentration measurements through SRS microscopy. (a) Representative SRS images (left) of deuterated glucose uptake in vancomycin-susceptible and vancomycin-resistant enterococci with and without 20 μg/mL vancomycin dosing. Raman intensity spectra (middle) of the carbon-deuterium signal in the two lines with and without vancomycin. Comparison of average Raman intensity for the two conditions for each enterococci line (right). *** indicates p-value <0.001 Panel adapted with permission from Reference 31; copyright 2018 American Chemical Society. (b) Brightfield (left) and SRS/second harmonic generation (green/red, respectively) of human gout tissue. Distances from the center of the tophus are shown. The cumulative SRS intensity of the monosodium urate crystals at 0, 10, and 20 mm away from the tophus center. N = 40 for each distance group using Kruskal-Wallis test followed by Dunn’s multiple comparisons test. NS indicates “No Significance” in the difference. **** indicates p-value <0.0001 Panel adapted with permission from Reference 33; copyright 2021 Ivyspring International Publisher. Abbreviations: NS, no significance in the difference; SRS, stimulated Raman scattering.

