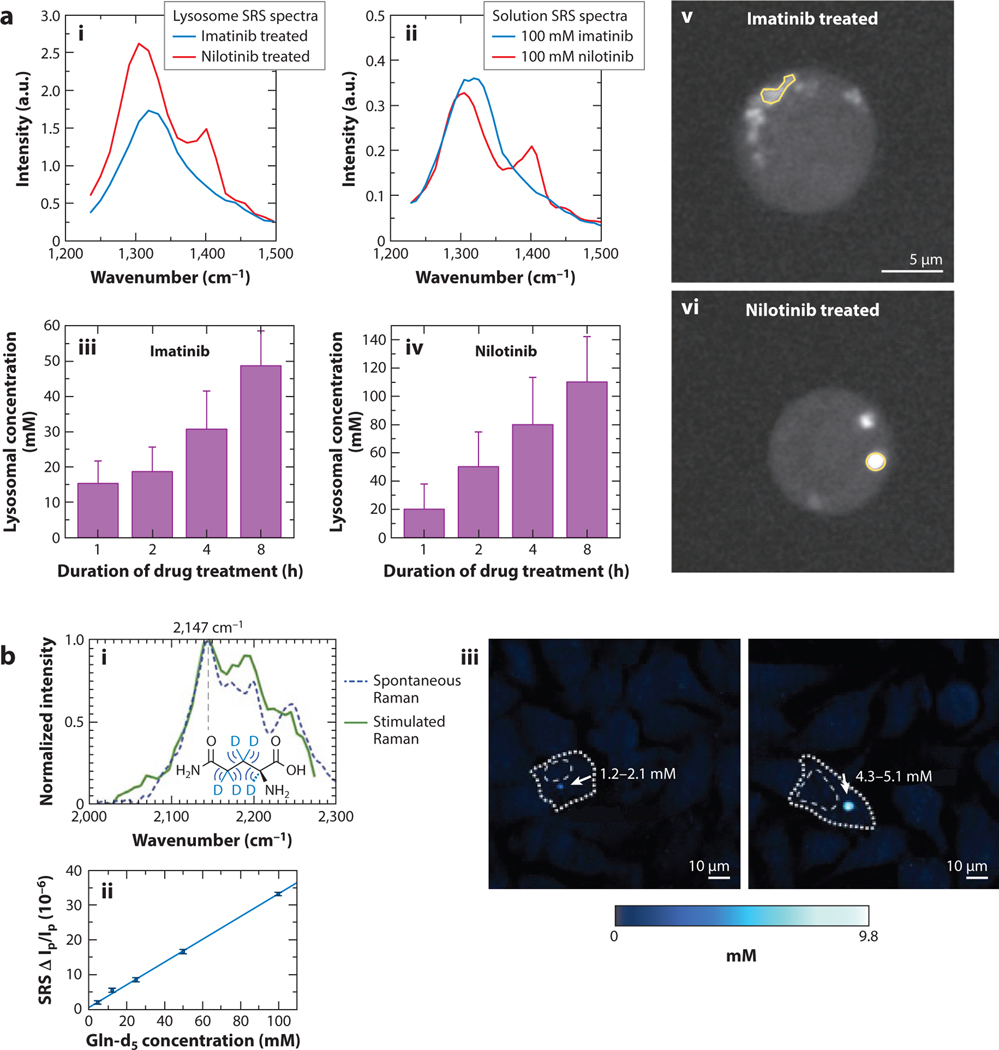
Figure 4.
Absolute concentration measurements with stimulated Raman scattering (SRS) microscopy. (a) Spectra of lysosome-sequestered (i) imatinib and (ii) nilotinib and solution spectra of the same drugs, time-lapse observed intracellular concentration of (iii) imatinib and nilotinib (iv), and representative images of BaF3 cells treated with (v) imatinib and nilotinib (vi). Panel adapted permission from Reference 81; copyright 2014 Nature Publishing Group. (b) Spontaneous and stimulated Raman spectra of the deuterated glutamine (i) and the linear response of its SRS signal with respect to concentration (ii). (iii) Representative carbon-deuterium SRS images with noted deuterated glutamine-tagged mHtt-97Q protein in intracellular protein aggregates. Panel adapted with permission from Reference 82; copyright 2020 American Chemical Society.

