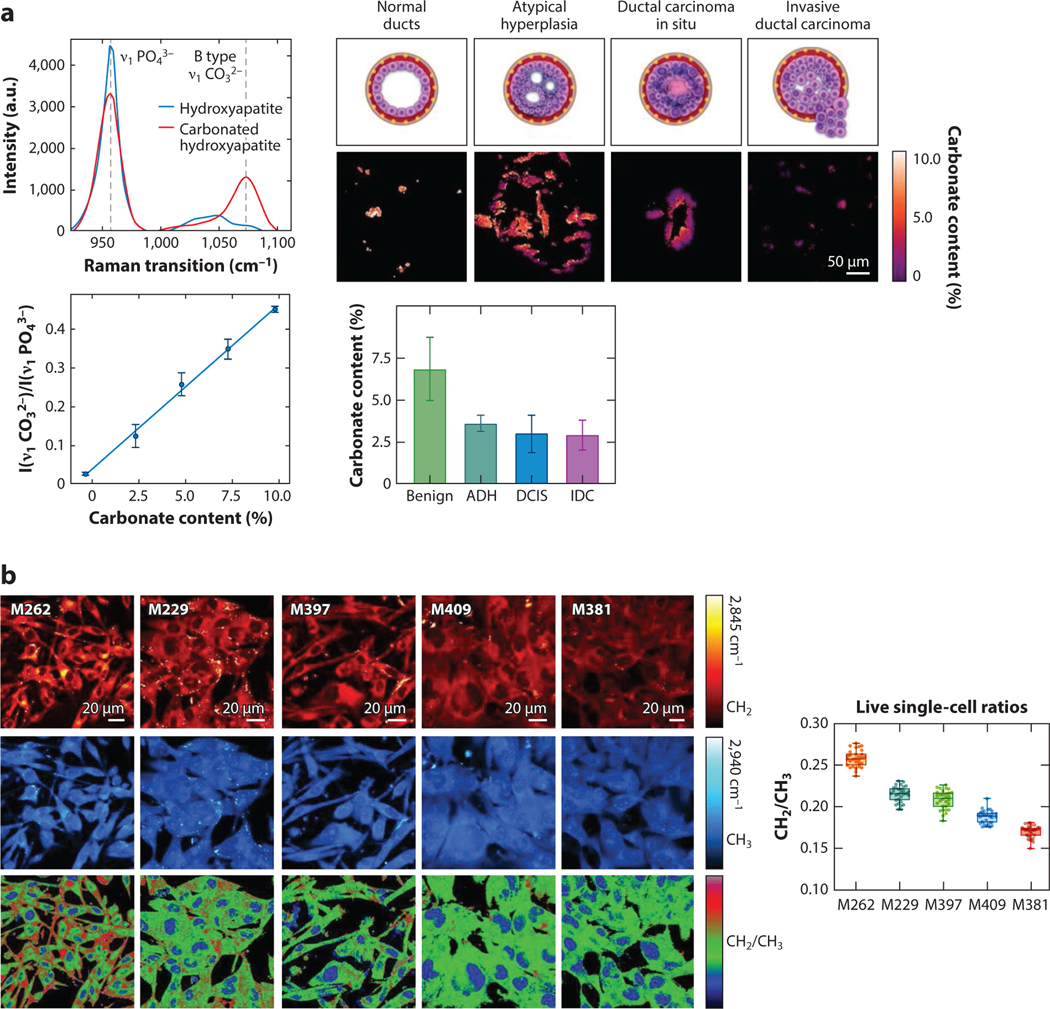
Figure 5.
Ratiometric measurements through SRS microscopy. (a) SRS spectra (upper left) of hydroxyapatite (blue) and carbonated hydroxyapatite (red) and the relevant Raman transitions for ratiometric comparison (960 cm−1 and 1,070 cm−1). The ratiometric calibration curve of carbonate content (lower left). Representative ratiometric images of carbonate content in breast calcifications at various levels of neoplastic progression and measured carbonate content for each pathological category. Panel adapted with permission from Reference 102; copyright 2020 Ivyspring International Publisher. (b) Representative SRS images (left) of various melanoma cell lines of varying differentiation at the lipid peak (2,845 cm−1; red), protein peak (2,940 cm−1; blue), and the ratio of lipid/protein (bottom). The average lipid/protein signal ratios across the different cell lines (right). Panel adapted with permission from Reference 103; copyright 2020 Nature Publishing Group. Abbreviations: ADH, atypical ductal hyperplasia; DCIS, ductal carcinoma in situ; IDC, invasive ductal carcinoma; SRS, stimulated Raman scattering.

