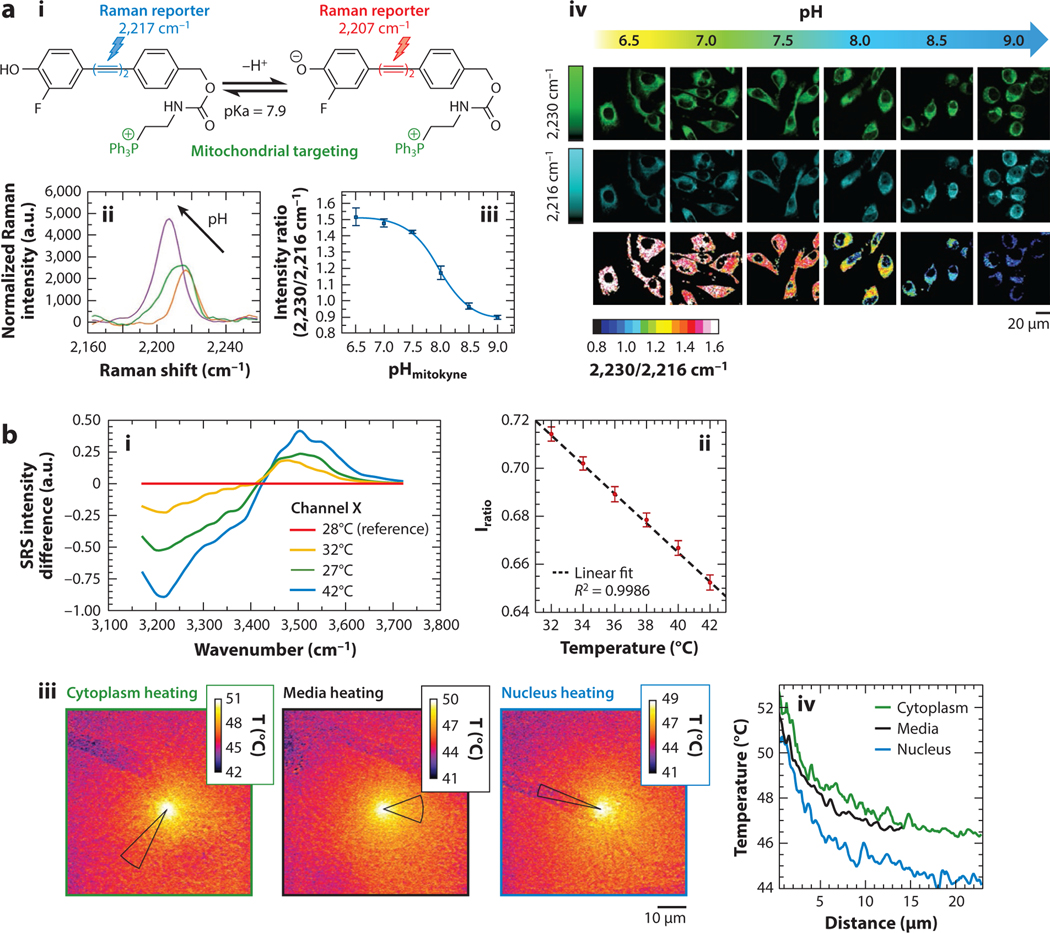
Figure 6.
Spectrally dynamic measurements with SRS microscopy. (a) The Raman dye molecule (i), mitokyne, and its SRS spectra (ii) showing the shifting peak in response to different pH. (iii) The SRS intensity ratio of 2,230/2,216 cm−1 with respect to pH (iv). Representative SRS images of HeLa cells treated with mitokyne at different controlled pH values at 2,216 cm−1, 2,230 cm−1, and their ratio. Panel adapted with permission from Reference 105; copyright 2021 American Chemical Society. (b) SRS difference spectra of liquid water at various temperatures (i). The calibration of the spectral intensity ratios and temperatures (ii). Temperature map images (iii) based on SRS signal of an A549 cell being heated with an infrared laser at different positions. Thermal decay curves (iv) with respect to distance for each field of view. Panel adapted with permission from Reference 106; copyright 2020 American Chemical Society. Abbreviations: a.u., arbitrary unit; SRS, stimulated Raman scattering.

