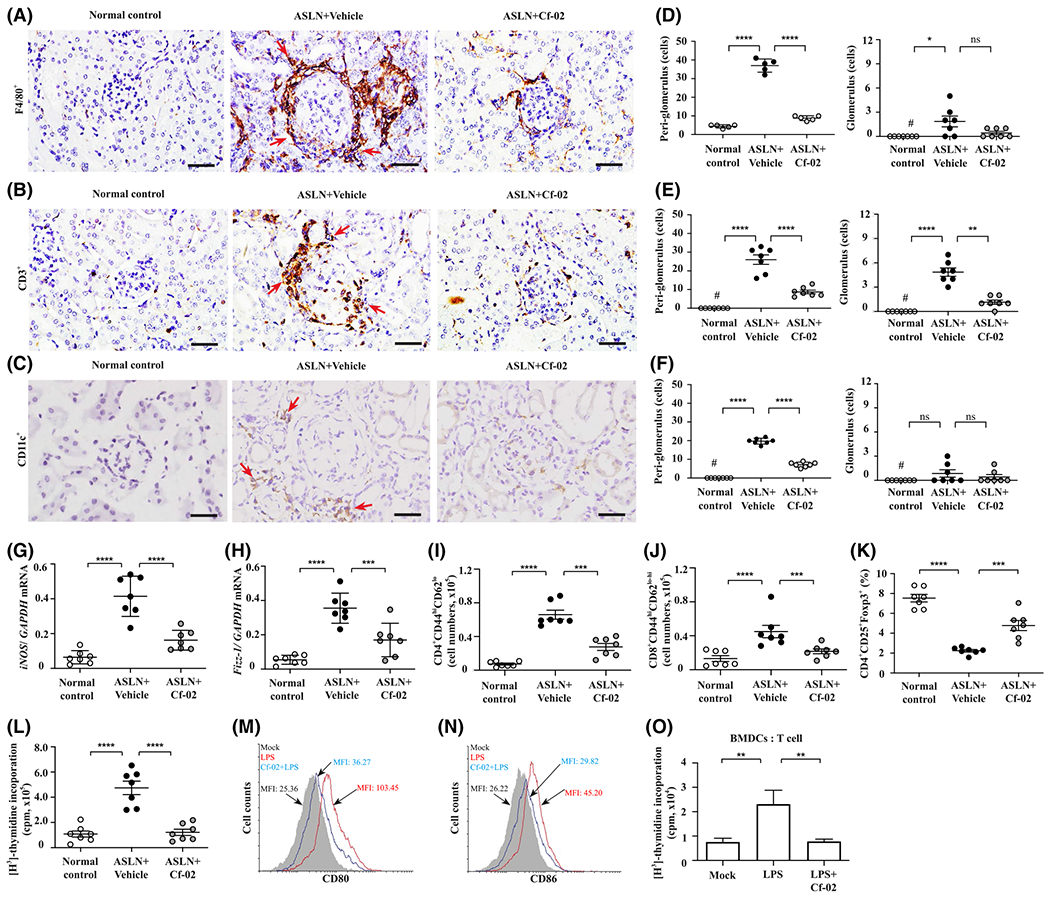
FIGURE 3.

Immunohistochemistry, real-time PCR assay, flow cytometry in ASLN mice and OT-II antigen-specific T cell proliferation analysis. A, F4/80+ macrophages infiltrating the kidney; (B) CD3+ T cells infiltrating the kidney; (C) CD11c+ dendritic cells infiltrating the kidney. IHC, Original magnification, 400×. The arrows indicate mononuclear leukocyte infiltration; (D-F) Scoring for IHC. Renal mRNA levels of (G) M1 and (H) M2 by real-time PCR assay. I, CD4+CD44hiCD62Llo T memory cells; (J) CD8+CD44hiCD62Llo-hi T memory cells; (K) CD4+CD25+Foxp3+ Treg cells. Flow cytometry using splenocytes. L, T cell proliferation analysis using splenocytes by [H3]-thymidine incorporation assay. Data are presented as means ± SEM with seven mice per group. M, CD11c+CD80+ and (N) CD11c+CD86+ in BMDCs determined by flow cytometry. O, OT-II antigen-specific T cell proliferation analysis using [H3]-thymidine incorporation assay. A 1:4 ratio of BMDCs to CD4+ T cells was used. ASLN, accelerated, severe lupus nephritis; BMDCs, bone marrow derived dendritic cells; Cf-02, a novel benzamide-linked small molecule; MFI, mean fluorescent intensity. *P < .05, **P < .01, ***P < .005 and ****P < .001. #Not detectable. ns, no significant difference
