
Figure 2. Circular Dichroism to investigate A-Z junction adoption and determine the extent of Z-RNA formation.
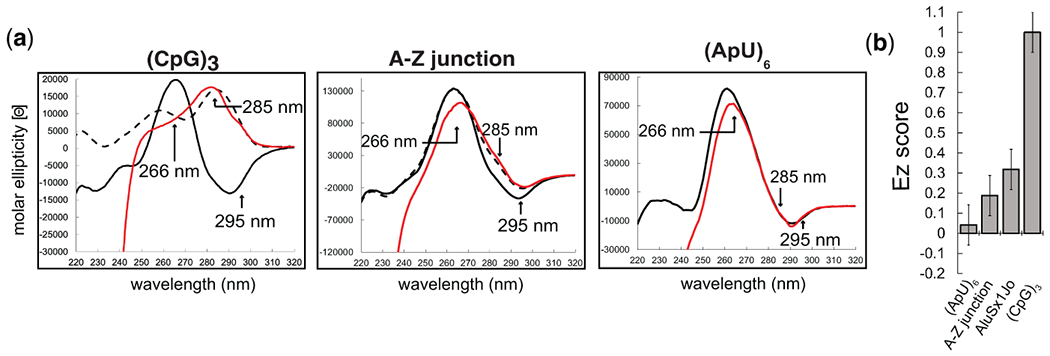
(a) CD spectra of the (CpG)3, an A-Z junction positive control, and an (ApU)6 negative control RNA in the absence of protein (black), with 6 M sodium perchlorate (dotted black line), and with a molar ratio of 1:6 RNA:Zα (red) at which binding is saturated. (b) Extent of Z-RNA (EZ) scores quantifying the extent of Z-conformation for the (ApU)6, A-Z junction control, AluSx1Jo, and (CpG)3 RNAs.