
Figure 5. Analytical Ultracentrifugation to determine the stoichiometry of A-Z junction:Zα complexes.
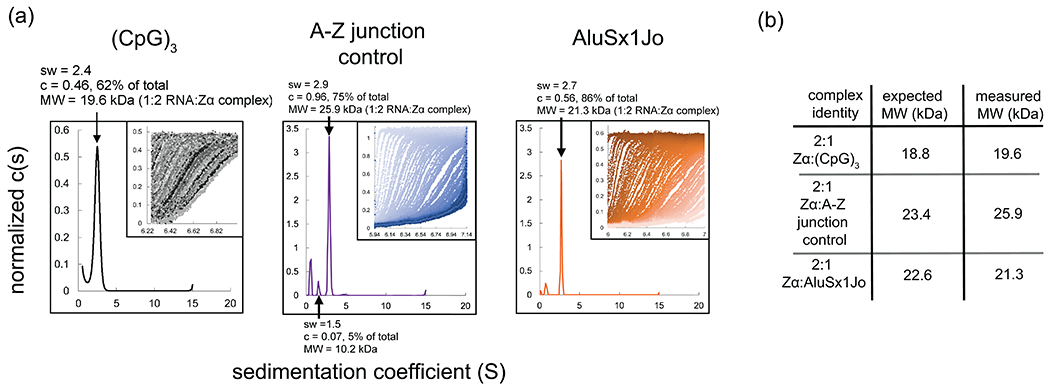
(a) Sedimentation coefficient distributions obtained by AUC for (CpG)3, A-Z junction control, and AluSx1Jo RNA. (b) The insets show the raw data from the AUC run with the window position on the x-axis and the absorbance on the y-axis, and individual scans over time going from left to right. (b) Predicted molecular weights for the different Zα:RNA complexes and measured molecular weights from AUC.