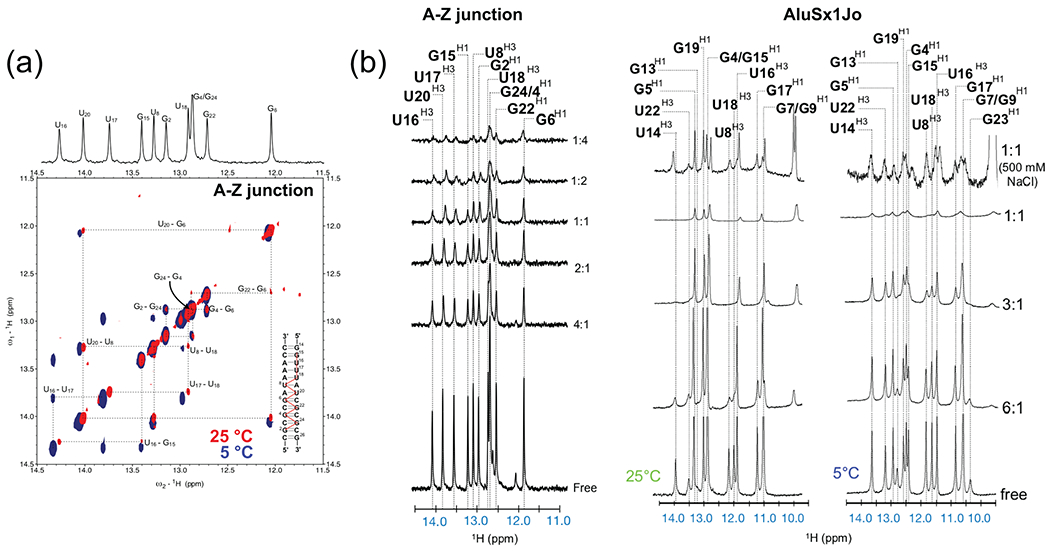
Figure 6. Nuclear Magnetic Resonance to determine regions adopting A-Z junctions, Z-conformation, or being destabilized by Zα binding.

(a) The imino regions of the 2D [1H,1H]-NOESY spectrum with a mixing time of 300 ms for the A-Z junction control RNA is shown. Imino proton connectivities (the “NOESY walk”) and assignments are shown with dashed lines and illustrated as red lines on the 2D secondary structure of the A-Z control. (b) The imino regions of the 1D 1H titration are shown for the A-Z RNA control and AluSx1Jo RNAs. Imino proton assignments are indicated with dashed lines. The ratio of RNA:Zα is indicated on the right-hand side of each trace.
