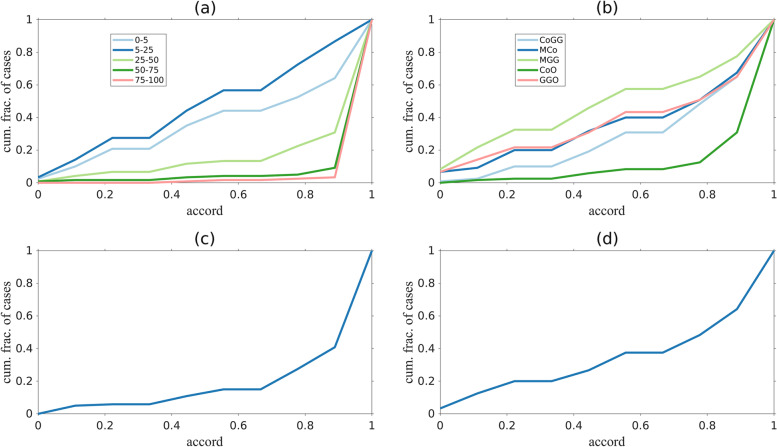
Fig. 6.
Cumulative fraction of cases as function of the accord for all clinical metrics: computed tomography severity score (a), lesion type (b), bilateral (c), and basal predominant (d) lesion distribution. Curves show the fraction of cases with accord less or equal to a given value. The larger the area under the curves, the lower the general accord. An accord = 1 indicates complete agreement, an accord equal to 0 indicates that half of the evaluators shared the opinion “x” (where “x” is one of the possible choices for a given metric), the other half shared the opinion “not-x”

