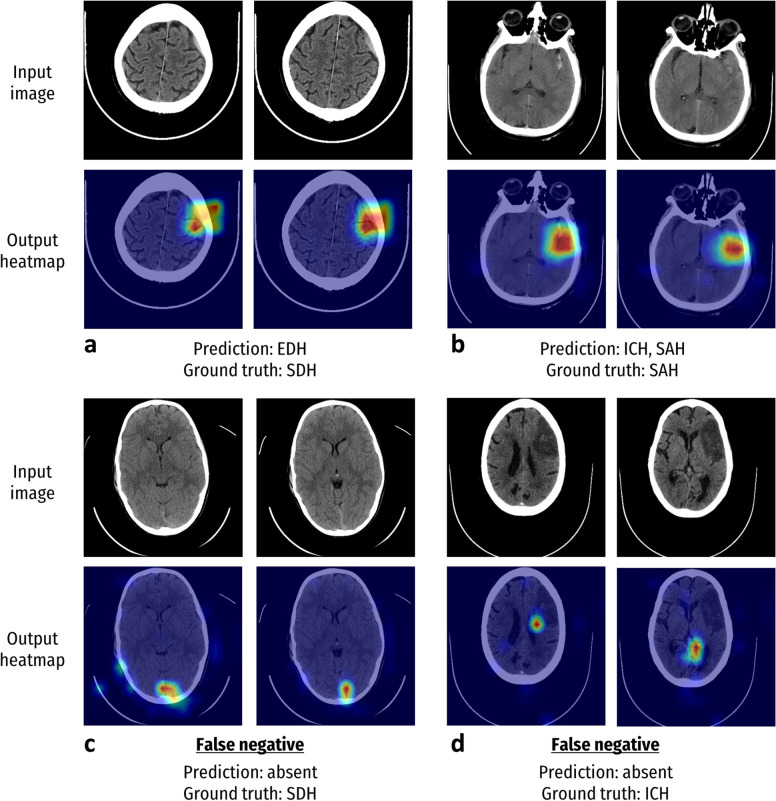
Fig. 4.
Visualisation of incorrect model predictions using heatmap images. Examples of the regions which contributed to the model decision in predicting haemorrhages. The warmer the colour (red > orange > yellow > green > blue), the greater the contribution of the image pixel to the prediction. a The model predicted an EDH, whereas the ground truth consensus label determined by radiologists was an SDH. Notably, the haemorrhage had a biconvex shape more closely associated with EDHs. b The model predicted ICH and SAH. Although one radiologist identified both SAH and ICH, the ground truth consensus only indicated the presence of a SAH. However, there are several subtle areas indicating possible ICH. c False negative in which the model missed a SDH. Although the model detected a suspicious area as indicated on the heatmap, it did not reach a sufficient threshold to be classified as a haemorrhage. Stagnant blood in the dural sinuses, which are benign and more common, can appear similar to SDH in this area, which may have contributed to the model error. d False negative in which the model missed an ICH. The heatmap indicated that the model did not appropriately detect areas of abnormality. The presence of chronic infarction here may have affected the model performance. EDH Extradural haemorrhage, ICH Intracerebral haemorrhage, IVH Intraventricular haemorrhage, SDH Subdural haemorrhage

