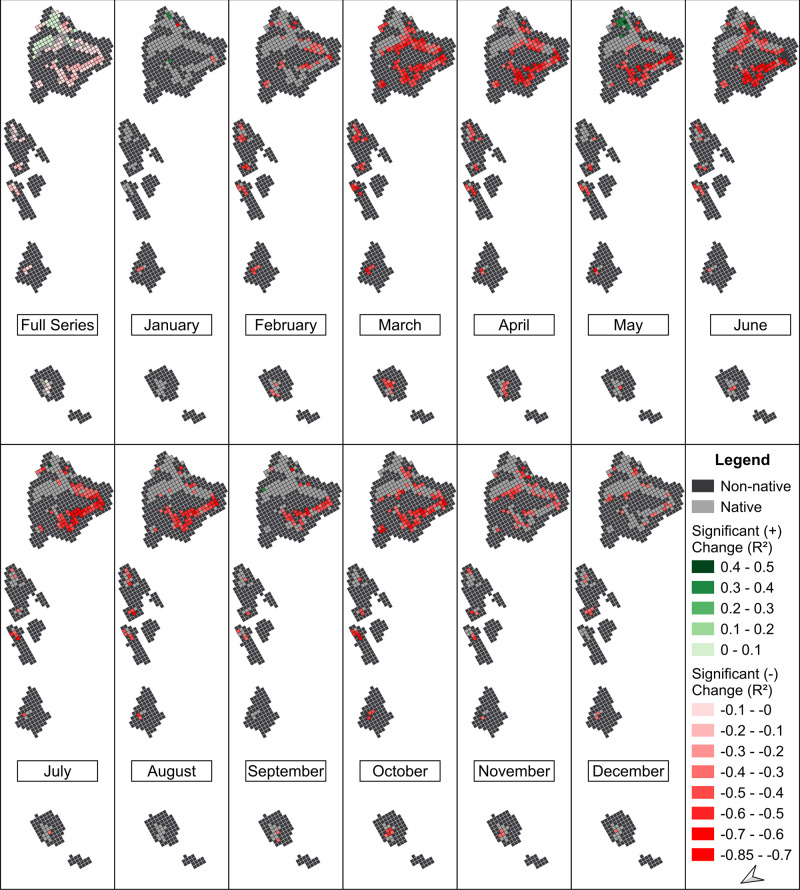
Fig. 7.
Significant changes in NDVI from a linear regression and Pearson correlation coefficient values (r) for the Native class across the full-time series (1982–2019). The “Full Series” subplot denotes changes over the entirety of the time series and the “Monthly” subplots denote changes over the full-time series for a given month. Red cells denote Native pixels with a significant negative change in median NDVI. Green cells denote Native pixels with a significant positive change in NDVI. Light-gray cells denote Native pixels without significant changes in NDVI. Dark-gray cells denote pixels with other land cover class types

