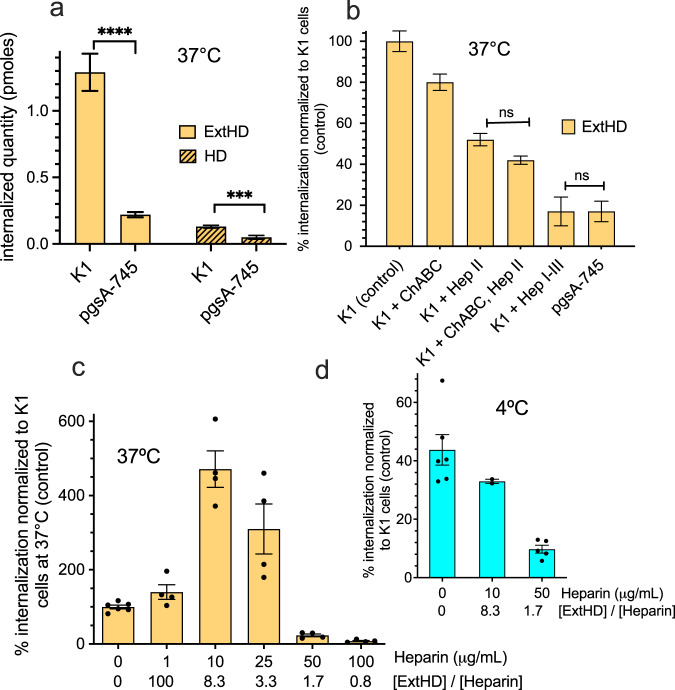
Fig. 2. Quantitation of ExtHD and HD internalization in cells and impact of GAGs content.
a Quantity (pmoles) of internalized ExtHD and HD incubated at 7 µM with 106 CHO-K1 or GAGdeficient pgsA-745 cells for 1 h at 37 °C (n = 27 and 18 for CHO-K1 and pgsA-745 cells, respectively). CHO-K1 express similar levels of HS and mono-sulfated chondroitins68; pgsA-745 express 10–30-fold lower GAGs levels than CHO-K128. b Quantity of internalized ExtHD incubated at 7 µM with cells for 1 h at 37 °C (n = 12–18). Data were normalized to the quantity of internalized ExtHD in control CHO-K1 cells. CHO-K1 cells were treated with enzymes degrading HS (heparinases I, II, III) or CS (chondroitinase ABC). c, d Quantity of internalized ExtHD in CHO-K1 cells in the absence and presence of increasing amounts of extracellular heparin (n = 2-6). One million cells were incubated with 7 μM protein in DMEM-F12 medium for 1 hr either at 37 °C (c) or 4 °C (d). Data were normalized to the intracellular quantity of ExtHD in control CHO-K1 cells at 37 °C in the absence of heparin. The ExtHD/heparin molar ratio is indicated for each heparin concentration. Data are presented as mean values + /- SEM. One-way ANOVA and unpaired t tests were used in a, b to determine if differences between values were significant: ****P < 0.0001, ***P = 0.0005, not significant (ns). The list of P values is provided in Supplementary Table 3.

